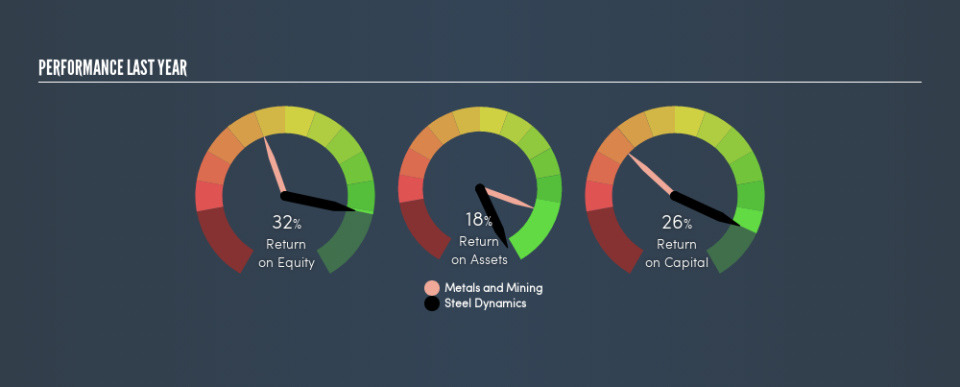
Why We Like Steel Dynamics, Inc.’s (NASDAQ:STLD) 26% Return On Capital Employed

Today we are going to look at Steel Dynamics, Inc. (NASDAQ:STLD) to see whether it might be an attractive investment prospect. Specifically, we’ll consider its Return On Capital Employed (ROCE), since that will give us an insight into how efficiently the business can generate profits from the capital it requires.
First up, we’ll look at what ROCE is and how we calculate it. Second, we’ll look at its ROCE compared to similar companies. Finally, we’ll look at how its current liabilities affect its ROCE.
Return On Capital Employed (ROCE): What is it?
ROCE is a measure of a company’s yearly pre-tax profit (its return), relative to the capital employed in the business. All else being equal, a better business will have a higher ROCE. Overall, it is a valuable metric that has its flaws. Author Edwin Whiting says to be careful when comparing the ROCE of different businesses, since ‘No two businesses are exactly alike.’
How Do You Calculate Return On Capital Employed?
The formula for calculating the return on capital employed is:
Return on Capital Employed = Earnings Before Interest and Tax (EBIT) ÷ (Total Assets – Current Liabilities)
Or for Steel Dynamics:
0.26 = US$1.7b ÷ (US$7.7b – US$1.0b) (Based on the trailing twelve months to December 2018.)
Therefore, Steel Dynamics has an ROCE of 26%.
Check out our latest analysis for Steel Dynamics
Does Steel Dynamics Have A Good ROCE?
When making comparisons between similar businesses, investors may find ROCE useful. In our analysis, Steel Dynamics’s ROCE is meaningfully higher than the 11% average in the Metals and Mining industry. We consider this a positive sign, because it suggests it uses capital more efficiently than similar companies. Putting aside its position relative to its industry for now, in absolute terms, Steel Dynamics’s ROCE is currently very good.
As we can see, Steel Dynamics currently has an ROCE of 26% compared to its ROCE 3 years ago, which was 6.3%. This makes us wonder if the company is improving.
It is important to remember that ROCE shows past performance, and is not necessarily predictive. ROCE can be misleading for companies in cyclical industries, with returns looking impressive during the boom times, but very weak during the busts. ROCE is, after all, simply a snap shot of a single year. Given the industry it operates in, Steel Dynamics could be considered cyclical. Since the future is so important for investors, you should check out our free report on analyst forecasts for Steel Dynamics.
Steel Dynamics’s Current Liabilities And Their Impact On Its ROCE
Short term (or current) liabilities, are things like supplier invoices, overdrafts, or tax bills that need to be paid within 12 months. Due to the way ROCE is calculated, a high level of current liabilities makes a company look as though it has less capital employed, and thus can (sometimes unfairly) boost the ROCE. To counteract this, we check if a company has high current liabilities, relative to its total assets.
Steel Dynamics has total liabilities of US$1.0b and total assets of US$7.7b. As a result, its current liabilities are equal to approximately 13% of its total assets. A minimal amount of current liabilities limits the impact on ROCE.
Our Take On Steel Dynamics’s ROCE
With low current liabilities and a high ROCE, Steel Dynamics could be worthy of further investigation. Of course, you might find a fantastic investment by looking at a few good candidates. So take a peek at this free list of companies with modest (or no) debt, trading on a P/E below 20.
I will like Steel Dynamics better if I see some big insider buys. While we wait, check out this free list of growing companies with considerable, recent, insider buying.
We aim to bring you long-term focused research analysis driven by fundamental data. Note that our analysis may not factor in the latest price-sensitive company announcements or qualitative material.
If you spot an error that warrants correction, please contact the editor at editorial-team@simplywallst.com. This article by Simply Wall St is general in nature. It does not constitute a recommendation to buy or sell any stock, and does not take account of your objectives, or your financial situation. Simply Wall St has no position in the stocks mentioned. Thank you for reading.
