Why Swiss Re Ltd’s (VTX:SREN) High P/E Ratio Isn’t Necessarily A Bad Thing

Want to participate in a short research study? Help shape the future of investing tools and receive a $20 prize!
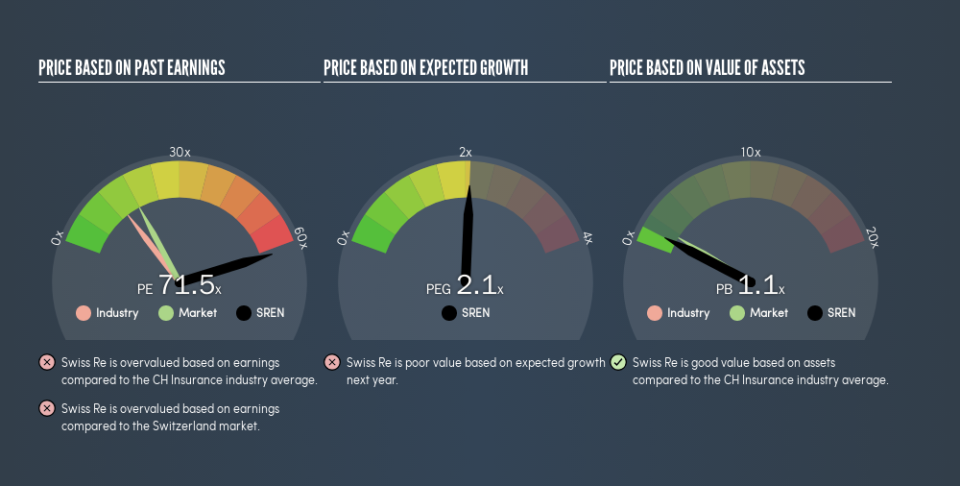
The goal of this article is to teach you how to use price to earnings ratios (P/E ratios). To keep it practical, we’ll show how Swiss Re Ltd’s (VTX:SREN) P/E ratio could help you assess the value on offer. Swiss Re has a price to earnings ratio of 71.48, based on the last twelve months. That corresponds to an earnings yield of approximately 1.4%.
View our latest analysis for Swiss Re
How Do You Calculate Swiss Re’s P/E Ratio?
The formula for P/E is:
Price to Earnings Ratio = Share Price (in reporting currency) ÷ Earnings per Share (EPS)
Or for Swiss Re:
P/E of 71.48 = $97.93 (Note: this is the share price in the reporting currency, namely, USD ) ÷ $1.37 (Based on the year to December 2018.)
Is A High Price-to-Earnings Ratio Good?
A higher P/E ratio means that investors are paying a higher price for each CHF1 of company earnings. That is not a good or a bad thing per se, but a high P/E does imply buyers are optimistic about the future.
How Growth Rates Impact P/E Ratios
When earnings fall, the ‘E’ decreases, over time. That means even if the current P/E is low, it will increase over time if the share price stays flat. A higher P/E should indicate the stock is expensive relative to others — and that may encourage shareholders to sell.
Swiss Re increased earnings per share by a whopping 33% last year. Unfortunately, earnings per share are down 31% a year, over 5 years.
How Does Swiss Re’s P/E Ratio Compare To Its Peers?
The P/E ratio essentially measures market expectations of a company. As you can see below, Swiss Re has a much higher P/E than the average company (13.9) in the insurance industry.
Its relatively high P/E ratio indicates that Swiss Re shareholders think it will perform better than other companies in its industry classification. The market is optimistic about the future, but that doesn’t guarantee future growth. So investors should always consider the P/E ratio alongside other factors, such as whether company directors have been buying shares.
A Limitation: P/E Ratios Ignore Debt and Cash In The Bank
It’s important to note that the P/E ratio considers the market capitalization, not the enterprise value. Thus, the metric does not reflect cash or debt held by the company. Hypothetically, a company could reduce its future P/E ratio by spending its cash (or taking on debt) to achieve higher earnings.
Such expenditure might be good or bad, in the long term, but the point here is that the balance sheet is not reflected by this ratio.
How Does Swiss Re’s Debt Impact Its P/E Ratio?
Swiss Re has net cash of US$4.7b. That should lead to a higher P/E than if it did have debt, because its strong balance sheets gives it more options.
The Verdict On Swiss Re’s P/E Ratio
Swiss Re’s P/E is 71.5 which is way above average (17.9) in the CH market. Its strong balance sheet gives the company plenty of resources for extra growth, and it has already proven it can grow. So it is not surprising the market is probably extrapolating recent growth well into the future, reflected in the relatively high P/E ratio.
Investors should be looking to buy stocks that the market is wrong about. As value investor Benjamin Graham famously said, ‘In the short run, the market is a voting machine but in the long run, it is a weighing machine.’ So this free report on the analyst consensus forecasts could help you make a master move on this stock.
Of course you might be able to find a better stock than Swiss Re. So you may wish to see this free collection of other companies that have grown earnings strongly.
We aim to bring you long-term focused research analysis driven by fundamental data. Note that our analysis may not factor in the latest price-sensitive company announcements or qualitative material.
If you spot an error that warrants correction, please contact the editor at editorial-team@simplywallst.com. This article by Simply Wall St is general in nature. It does not constitute a recommendation to buy or sell any stock, and does not take account of your objectives, or your financial situation. Simply Wall St has no position in the stocks mentioned. Thank you for reading.
