Is Winnebago Industries, Inc.'s (NYSE:WGO) Recent Performance Tethered To Its Attractive Financial Prospects?
Most readers would already know that Winnebago Industries' (NYSE:WGO) stock increased by 8.3% over the past three months. Since the market usually pay for a company’s long-term financial health, we decided to study the company’s fundamentals to see if they could be influencing the market. Specifically, we decided to study Winnebago Industries' ROE in this article.
Return on Equity or ROE is a test of how effectively a company is growing its value and managing investors’ money. In other words, it is a profitability ratio which measures the rate of return on the capital provided by the company's shareholders.
See our latest analysis for Winnebago Industries
How Is ROE Calculated?
Return on equity can be calculated by using the formula:
Return on Equity = Net Profit (from continuing operations) ÷ Shareholders' Equity
So, based on the above formula, the ROE for Winnebago Industries is:
27% = US$351m ÷ US$1.3b (Based on the trailing twelve months to November 2022).
The 'return' refers to a company's earnings over the last year. So, this means that for every $1 of its shareholder's investments, the company generates a profit of $0.27.
What Is The Relationship Between ROE And Earnings Growth?
We have already established that ROE serves as an efficient profit-generating gauge for a company's future earnings. Depending on how much of these profits the company reinvests or "retains", and how effectively it does so, we are then able to assess a company’s earnings growth potential. Generally speaking, other things being equal, firms with a high return on equity and profit retention, have a higher growth rate than firms that don’t share these attributes.
Winnebago Industries' Earnings Growth And 27% ROE
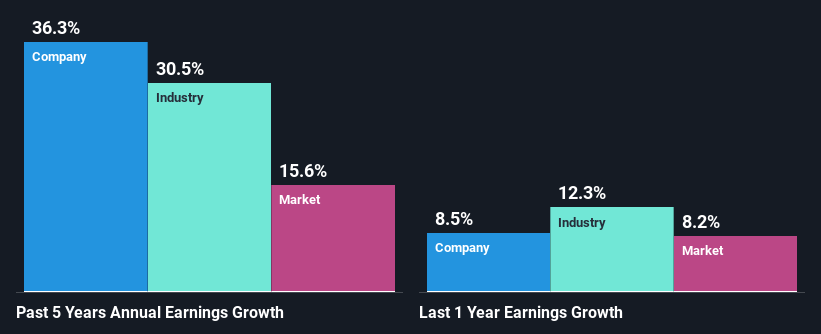
To begin with, Winnebago Industries has a pretty high ROE which is interesting. Additionally, a comparison with the average industry ROE of 27% also portrays the company's ROE in a good light. Given the circumstances, the significant 36% net income growth seen by Winnebago Industries over the last five years is not surprising.
We then performed a comparison between Winnebago Industries' net income growth with the industry, which revealed that the company's growth is similar to the average industry growth of 30% in the same period.
Earnings growth is a huge factor in stock valuation. What investors need to determine next is if the expected earnings growth, or the lack of it, is already built into the share price. Doing so will help them establish if the stock's future looks promising or ominous. Has the market priced in the future outlook for WGO? You can find out in our latest intrinsic value infographic research report.
Is Winnebago Industries Making Efficient Use Of Its Profits?
Winnebago Industries has a really low three-year median payout ratio of 7.3%, meaning that it has the remaining 93% left over to reinvest into its business. So it looks like Winnebago Industries is reinvesting profits heavily to grow its business, which shows in its earnings growth.
Additionally, Winnebago Industries has paid dividends over a period of eight years which means that the company is pretty serious about sharing its profits with shareholders. Looking at the current analyst consensus data, we can see that the company's future payout ratio is expected to rise to 9.9% over the next three years. Therefore, the expected rise in the payout ratio explains why the company's ROE is expected to decline to 21% over the same period.
Summary
On the whole, we feel that Winnebago Industries' performance has been quite good. Specifically, we like that the company is reinvesting a huge chunk of its profits at a high rate of return. This of course has caused the company to see substantial growth in its earnings. That being so, a study of the latest analyst forecasts show that the company is expected to see a slowdown in its future earnings growth. To know more about the company's future earnings growth forecasts take a look at this free report on analyst forecasts for the company to find out more.
Have feedback on this article? Concerned about the content? Get in touch with us directly. Alternatively, email editorial-team (at) simplywallst.com.
This article by Simply Wall St is general in nature. We provide commentary based on historical data and analyst forecasts only using an unbiased methodology and our articles are not intended to be financial advice. It does not constitute a recommendation to buy or sell any stock, and does not take account of your objectives, or your financial situation. We aim to bring you long-term focused analysis driven by fundamental data. Note that our analysis may not factor in the latest price-sensitive company announcements or qualitative material. Simply Wall St has no position in any stocks mentioned.
Join A Paid User Research Session
You’ll receive a US$30 Amazon Gift card for 1 hour of your time while helping us build better investing tools for the individual investors like yourself. Sign up here
