Should You Be Worried About Redcape Hotel Group’s (ASX:RDC) 4.3% Return On Equity?

Many investors are still learning about the various metrics that can be useful when analysing a stock. This article is for those who would like to learn about Return On Equity (ROE). To keep the lesson grounded in practicality, we’ll use ROE to better understand Redcape Hotel Group (ASX:RDC).
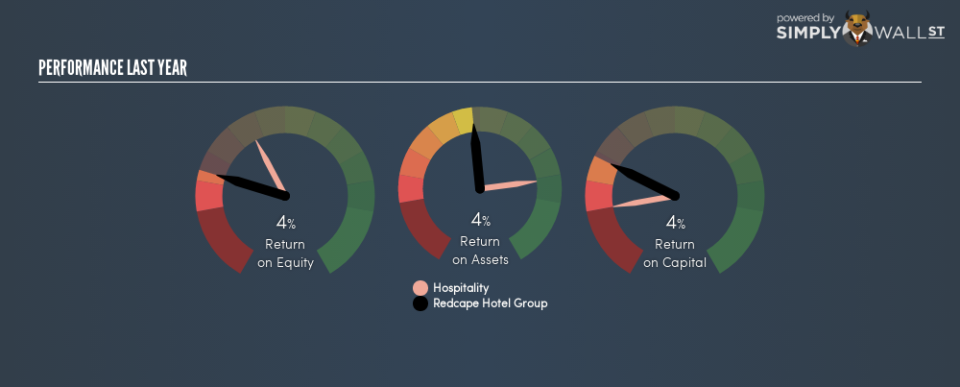
Over the last twelve months Redcape Hotel Group has recorded a ROE of 4.3%. Another way to think of that is that for every A$1 worth of equity in the company, it was able to earn A$0.043.
See our latest analysis for Redcape Hotel Group
How Do You Calculate Return On Equity?
The formula for return on equity is:
Return on Equity = Net Profit ÷ Shareholders’ Equity
Or for Redcape Hotel Group:
4.3% = 26.8 ÷ AU$621m (Based on the trailing twelve months to June 2018.)
Most know that net profit is the total earnings after all expenses, but the concept of shareholders’ equity is a little more complicated. It is all earnings retained by the company, plus any capital paid in by shareholders. The easiest way to calculate shareholders’ equity is to subtract the company’s total liabilities from the total assets.
What Does Return On Equity Signify?
ROE looks at the amount a company earns relative to the money it has kept within the business. The ‘return’ is the yearly profit. The higher the ROE, the more profit the company is making. So, all else being equal, a high ROE is better than a low one. Clearly, then, one can use ROE to compare different companies.
Does Redcape Hotel Group Have A Good ROE?
By comparing a company’s ROE with its industry average, we can get a quick measure of how good it is. Importantly, this is far from a perfect measure, because companies differ significantly within the same industry classification. If you look at the image below, you can see Redcape Hotel Group has a lower ROE than the average (12%) in the Hospitality industry classification.
That’s not what we like to see. We’d prefer see an ROE above the industry average, but it might not matter if the company is undervalued. Still, shareholders might want to check if insiders have been selling.
How Does Debt Impact Return On Equity?
Companies usually need to invest money to grow their profits. That cash can come from retained earnings, issuing new shares (equity), or debt. In the first two cases, the ROE will capture this use of capital to grow. In the latter case, the debt used for growth will improve returns, but won’t affect the total equity. Thus the use of debt can improve ROE, albeit along with extra risk in the case of stormy weather, metaphorically speaking.
Redcape Hotel Group’s Debt And Its 4.3% ROE
Redcape Hotel Group has a debt to equity ratio of 0.70, which is far from excessive. Its ROE is quite low, and the company already has some debt, so surely shareholders are hoping for an improvement. Careful use of debt to boost returns is often very good for shareholders. However, it could reduce the company’s ability to take advantage of future opportunities.
But It’s Just One Metric
Return on equity is useful for comparing the quality of different businesses. A company that can achieve a high return on equity without debt could be considered a high quality business. All else being equal, a higher ROE is better.
Having said that, while ROE is a useful indicator of business quality, you’ll have to look at a whole range of factors to determine the right price to buy a stock. It is important to consider other factors, such as future profit growth — and how much investment is required going forward. So you might want to take a peek at this data-rich interactive graph of forecasts for the company.
Of course Redcape Hotel Group may not be the best stock to buy. So you may wish to see this free collection of other companies that have high ROE and low debt.
To help readers see past the short term volatility of the financial market, we aim to bring you a long-term focused research analysis purely driven by fundamental data. Note that our analysis does not factor in the latest price-sensitive company announcements.
The author is an independent contributor and at the time of publication had no position in the stocks mentioned. For errors that warrant correction please contact the editor at editorial-team@simplywallst.com.
