Should You Be Worried About Shanghai Jiaoda Withub Information Industrial Company Limited's (HKG:8205) 6.2% Return On Equity?

Want to participate in a short research study? Help shape the future of investing tools and you could win a $250 gift card!
Many investors are still learning about the various metrics that can be useful when analysing a stock. This article is for those who would like to learn about Return On Equity (ROE). We'll use ROE to examine Shanghai Jiaoda Withub Information Industrial Company Limited (HKG:8205), by way of a worked example.
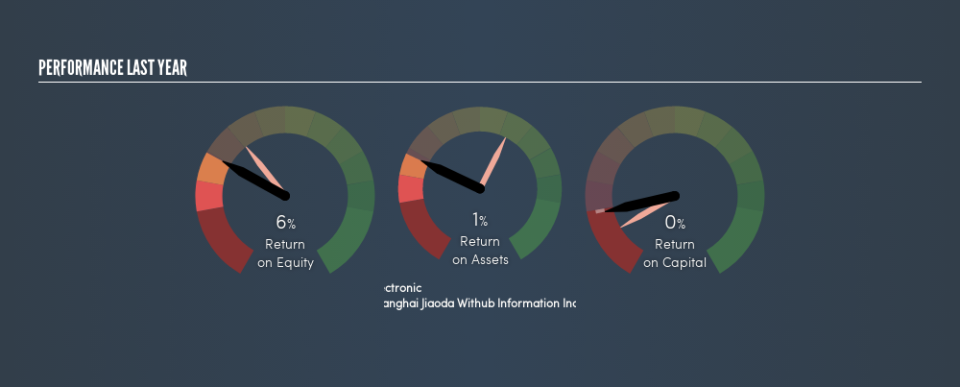
Our data shows Shanghai Jiaoda Withub Information Industrial has a return on equity of 6.2% for the last year. That means that for every HK$1 worth of shareholders' equity, it generated HK$0.062 in profit.
Check out our latest analysis for Shanghai Jiaoda Withub Information Industrial
How Do I Calculate Return On Equity?
The formula for return on equity is:
Return on Equity = Net Profit ÷ Shareholders' Equity
Or for Shanghai Jiaoda Withub Information Industrial:
6.2% = CN¥4.4m ÷ CN¥71m (Based on the trailing twelve months to March 2019.)
It's easy to understand the 'net profit' part of that equation, but 'shareholders' equity' requires further explanation. It is all the money paid into the company from shareholders, plus any earnings retained. The easiest way to calculate shareholders' equity is to subtract the company's total liabilities from the total assets.
What Does Return On Equity Signify?
ROE looks at the amount a company earns relative to the money it has kept within the business. The 'return' is the amount earned after tax over the last twelve months. That means that the higher the ROE, the more profitable the company is. So, all else being equal, a high ROE is better than a low one. That means it can be interesting to compare the ROE of different companies.
Does Shanghai Jiaoda Withub Information Industrial Have A Good ROE?
One simple way to determine if a company has a good return on equity is to compare it to the average for its industry. The limitation of this approach is that some companies are quite different from others, even within the same industry classification. As shown in the graphic below, Shanghai Jiaoda Withub Information Industrial has a lower ROE than the average (9.8%) in the Electronic industry classification.
That certainly isn't ideal. We'd prefer see an ROE above the industry average, but it might not matter if the company is undervalued. Still, shareholders might want to check if insiders have been selling.
The Importance Of Debt To Return On Equity
Companies usually need to invest money to grow their profits. That cash can come from issuing shares, retained earnings, or debt. In the first two cases, the ROE will capture this use of capital to grow. In the latter case, the debt required for growth will boost returns, but will not impact the shareholders' equity. Thus the use of debt can improve ROE, albeit along with extra risk in the case of stormy weather, metaphorically speaking.
Shanghai Jiaoda Withub Information Industrial's Debt And Its 6.2% ROE
Shanghai Jiaoda Withub Information Industrial is free of net debt, which is a positive for shareholders. Although I don't find its ROE that impressive, it's worth remembering it achieved these returns without debt. At the end of the day, when a company has zero debt, it is in a better position to take future growth opportunities.
In Summary
Return on equity is one way we can compare the business quality of different companies. In my book the highest quality companies have high return on equity, despite low debt. All else being equal, a higher ROE is better.
But ROE is just one piece of a bigger puzzle, since high quality businesses often trade on high multiples of earnings. It is important to consider other factors, such as future profit growth -- and how much investment is required going forward. So I think it may be worth checking this free this detailed graph of past earnings, revenue and cash flow .
If you would prefer check out another company -- one with potentially superior financials -- then do not miss this free list of interesting companies, that have HIGH return on equity and low debt.
We aim to bring you long-term focused research analysis driven by fundamental data. Note that our analysis may not factor in the latest price-sensitive company announcements or qualitative material.
If you spot an error that warrants correction, please contact the editor at editorial-team@simplywallst.com. This article by Simply Wall St is general in nature. It does not constitute a recommendation to buy or sell any stock, and does not take account of your objectives, or your financial situation. Simply Wall St has no position in the stocks mentioned. Thank you for reading.
