Should We Worry About Chicago Rivet & Machine Co.'s (NYSEMKT:CVR) P/E Ratio?

The goal of this article is to teach you how to use price to earnings ratios (P/E ratios). We'll apply a basic P/E ratio analysis to Chicago Rivet & Machine Co.'s (NYSEMKT:CVR), to help you decide if the stock is worth further research. Based on the last twelve months, Chicago Rivet & Machine's P/E ratio is 24.01. That is equivalent to an earnings yield of about 4.2%.
See our latest analysis for Chicago Rivet & Machine
How Do You Calculate A P/E Ratio?
The formula for P/E is:
Price to Earnings Ratio = Price per Share ÷ Earnings per Share (EPS)
Or for Chicago Rivet & Machine:
P/E of 24.01 = $27.5 ÷ $1.15 (Based on the trailing twelve months to June 2019.)
Is A High Price-to-Earnings Ratio Good?
A higher P/E ratio means that investors are paying a higher price for each $1 of company earnings. That is not a good or a bad thing per se, but a high P/E does imply buyers are optimistic about the future.
Does Chicago Rivet & Machine Have A Relatively High Or Low P/E For Its Industry?
The P/E ratio essentially measures market expectations of a company. The image below shows that Chicago Rivet & Machine has a higher P/E than the average (19.3) P/E for companies in the machinery industry.
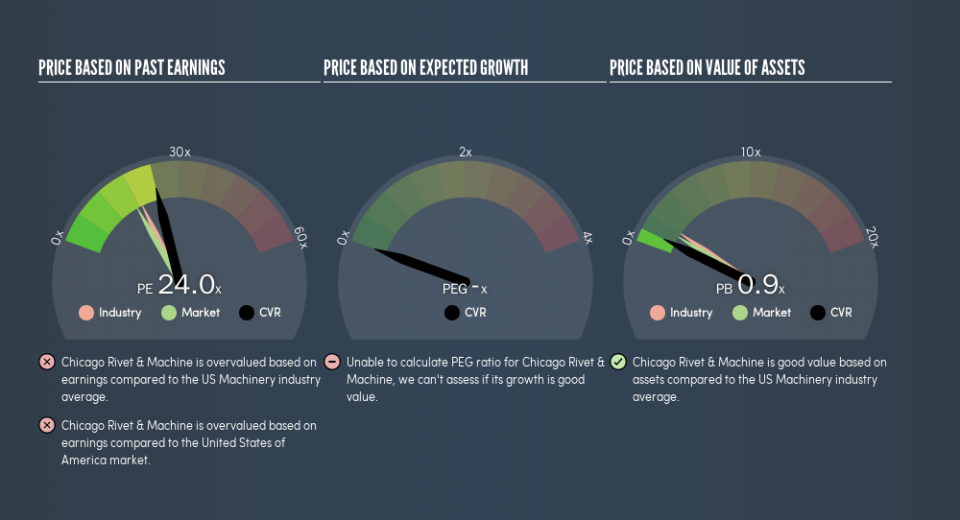
Its relatively high P/E ratio indicates that Chicago Rivet & Machine shareholders think it will perform better than other companies in its industry classification. Clearly the market expects growth, but it isn't guaranteed. So investors should always consider the P/E ratio alongside other factors, such as whether company directors have been buying shares.
How Growth Rates Impact P/E Ratios
If earnings fall then in the future the 'E' will be lower. That means even if the current P/E is low, it will increase over time if the share price stays flat. A higher P/E should indicate the stock is expensive relative to others -- and that may encourage shareholders to sell.
Chicago Rivet & Machine shrunk earnings per share by 56% over the last year. And it has shrunk its earnings per share by 15% per year over the last five years. This growth rate might warrant a below average P/E ratio.
Don't Forget: The P/E Does Not Account For Debt or Bank Deposits
One drawback of using a P/E ratio is that it considers market capitalization, but not the balance sheet. In other words, it does not consider any debt or cash that the company may have on the balance sheet. In theory, a company can lower its future P/E ratio by using cash or debt to invest in growth.
Such spending might be good or bad, overall, but the key point here is that you need to look at debt to understand the P/E ratio in context.
Chicago Rivet & Machine's Balance Sheet
With net cash of US$6.5m, Chicago Rivet & Machine has a very strong balance sheet, which may be important for its business. Having said that, at 24% of its market capitalization the cash hoard would contribute towards a higher P/E ratio.
The Bottom Line On Chicago Rivet & Machine's P/E Ratio
Chicago Rivet & Machine trades on a P/E ratio of 24, which is above its market average of 17.4. The recent drop in earnings per share might keep value investors away, but the net cash position means the company has time to improve: and the high P/E suggests the market thinks it will.
Investors have an opportunity when market expectations about a stock are wrong. If the reality for a company is better than it expects, you can make money by buying and holding for the long term. We don't have analyst forecasts, but you could get a better understanding of its growth by checking out this more detailed historical graph of earnings, revenue and cash flow.
Of course, you might find a fantastic investment by looking at a few good candidates. So take a peek at this free list of companies with modest (or no) debt, trading on a P/E below 20.
We aim to bring you long-term focused research analysis driven by fundamental data. Note that our analysis may not factor in the latest price-sensitive company announcements or qualitative material.
If you spot an error that warrants correction, please contact the editor at editorial-team@simplywallst.com. This article by Simply Wall St is general in nature. It does not constitute a recommendation to buy or sell any stock, and does not take account of your objectives, or your financial situation. Simply Wall St has no position in the stocks mentioned. Thank you for reading.
