Should You Worry About eForce Holdings Limited’s (HKG:943) ROCE?

Want to participate in a research study? Help shape the future of investing tools and earn a $60 gift card!
Today we'll look at eForce Holdings Limited (HKG:943) and reflect on its potential as an investment. In particular, we'll consider its Return On Capital Employed (ROCE), as that can give us insight into how profitably the company is able to employ capital in its business.
Firstly, we'll go over how we calculate ROCE. Then we'll compare its ROCE to similar companies. Then we'll determine how its current liabilities are affecting its ROCE.
Understanding Return On Capital Employed (ROCE)
ROCE is a metric for evaluating how much pre-tax income (in percentage terms) a company earns on the capital invested in its business. All else being equal, a better business will have a higher ROCE. Ultimately, it is a useful but imperfect metric. Author Edwin Whiting says to be careful when comparing the ROCE of different businesses, since 'No two businesses are exactly alike.'
So, How Do We Calculate ROCE?
Analysts use this formula to calculate return on capital employed:
Return on Capital Employed = Earnings Before Interest and Tax (EBIT) ÷ (Total Assets - Current Liabilities)
Or for eForce Holdings:
0.015 = HK$19m ÷ (HK$1.4b - HK$152m) (Based on the trailing twelve months to December 2018.)
Therefore, eForce Holdings has an ROCE of 1.5%.
See our latest analysis for eForce Holdings
Does eForce Holdings Have A Good ROCE?
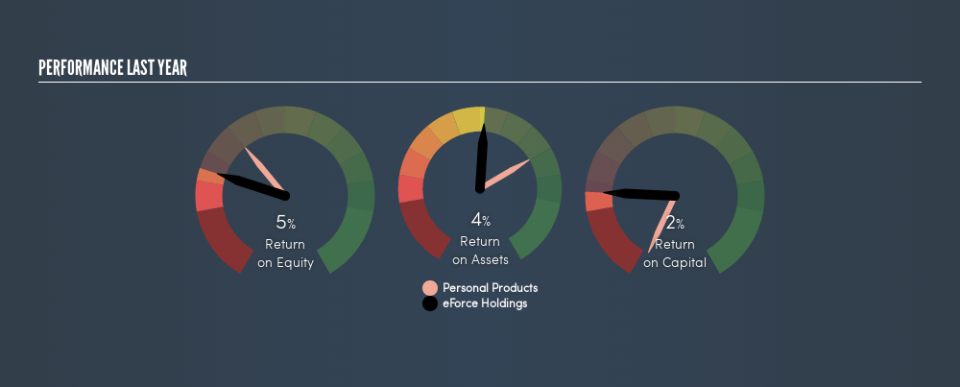
ROCE is commonly used for comparing the performance of similar businesses. We can see eForce Holdings's ROCE is meaningfully below the Personal Products industry average of 11%. This performance is not ideal, as it suggests the company may not be deploying its capital as effectively as some competitors. Independently of how eForce Holdings compares to its industry, its ROCE in absolute terms is low; especially compared to the ~2.0% available in government bonds. Readers may wish to look for more rewarding investments.
eForce Holdings delivered an ROCE of 1.5%, which is better than 3 years ago, as was making losses back then. That implies the business has been improving.
It is important to remember that ROCE shows past performance, and is not necessarily predictive. ROCE can be deceptive for cyclical businesses, as returns can look incredible in boom times, and terribly low in downturns. ROCE is only a point-in-time measure. How cyclical is eForce Holdings? You can see for yourself by looking at this free graph of past earnings, revenue and cash flow.
Do eForce Holdings's Current Liabilities Skew Its ROCE?
Current liabilities include invoices, such as supplier payments, short-term debt, or a tax bill, that need to be paid within 12 months. The ROCE equation subtracts current liabilities from capital employed, so a company with a lot of current liabilities appears to have less capital employed, and a higher ROCE than otherwise. To counteract this, we check if a company has high current liabilities, relative to its total assets.
eForce Holdings has total liabilities of HK$152m and total assets of HK$1.4b. Therefore its current liabilities are equivalent to approximately 11% of its total assets. This is not a high level of current liabilities, which would not boost the ROCE by much.
What We Can Learn From eForce Holdings's ROCE
That's not a bad thing, however eForce Holdings has a weak ROCE and may not be an attractive investment. Of course you might be able to find a better stock than eForce Holdings. So you may wish to see this free collection of other companies that have grown earnings strongly.
I will like eForce Holdings better if I see some big insider buys. While we wait, check out this free list of growing companies with considerable, recent, insider buying.
We aim to bring you long-term focused research analysis driven by fundamental data. Note that our analysis may not factor in the latest price-sensitive company announcements or qualitative material.
If you spot an error that warrants correction, please contact the editor at editorial-team@simplywallst.com. This article by Simply Wall St is general in nature. It does not constitute a recommendation to buy or sell any stock, and does not take account of your objectives, or your financial situation. Simply Wall St has no position in the stocks mentioned. Thank you for reading.
