Should We Worry About LendLease Group’s (ASX:LLC) P/E Ratio?

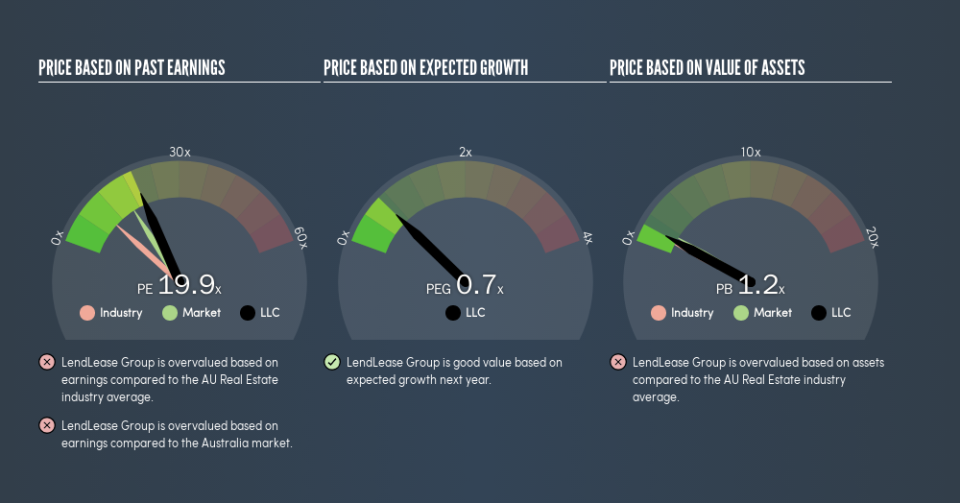
This article is written for those who want to get better at using price to earnings ratios (P/E ratios). To keep it practical, we’ll show how LendLease Group’s (ASX:LLC) P/E ratio could help you assess the value on offer. Based on the last twelve months, LendLease Group’s P/E ratio is 19.88. In other words, at today’s prices, investors are paying A$19.88 for every A$1 in prior year profit.
Check out our latest analysis for LendLease Group
How Do You Calculate A P/E Ratio?
The formula for price to earnings is:
Price to Earnings Ratio = Price per Share ÷ Earnings per Share (EPS)
Or for LendLease Group:
P/E of 19.88 = A$13.3 ÷ A$0.67 (Based on the year to December 2018.)
Is A High P/E Ratio Good?
A higher P/E ratio means that investors are paying a higher price for each A$1 of company earnings. That isn’t necessarily good or bad, but a high P/E implies relatively high expectations of what a company can achieve in the future.
How Growth Rates Impact P/E Ratios
If earnings fall then in the future the ‘E’ will be lower. That means unless the share price falls, the P/E will increase in a few years. Then, a higher P/E might scare off shareholders, pushing the share price down.
LendLease Group saw earnings per share decrease by 51% last year. And it has shrunk its earnings per share by 2.6% per year over the last five years. This growth rate might warrant a below average P/E ratio.
How Does LendLease Group’s P/E Ratio Compare To Its Peers?
The P/E ratio essentially measures market expectations of a company. You can see in the image below that the average P/E (9.5) for companies in the real estate industry is lower than LendLease Group’s P/E.
LendLease Group’s P/E tells us that market participants think the company will perform better than its industry peers, going forward. Clearly the market expects growth, but it isn’t guaranteed. So investors should always consider the P/E ratio alongside other factors, such as whether company directors have been buying shares.
Remember: P/E Ratios Don’t Consider The Balance Sheet
The ‘Price’ in P/E reflects the market capitalization of the company. That means it doesn’t take debt or cash into account. Theoretically, a business can improve its earnings (and produce a lower P/E in the future), by taking on debt (or spending its remaining cash).
Such spending might be good or bad, overall, but the key point here is that you need to look at debt to understand the P/E ratio in context.
How Does LendLease Group’s Debt Impact Its P/E Ratio?
LendLease Group has net debt worth 30% of its market capitalization. This is a reasonably significant level of debt — all else being equal you’d expect a much lower P/E than if it had net cash.
The Bottom Line On LendLease Group’s P/E Ratio
LendLease Group’s P/E is 19.9 which is above average (16.1) in the AU market. With a bit of debt, but a lack of recent growth, it’s safe to say the market is expecting improved profit performance from the company, in the next few years.
Investors should be looking to buy stocks that the market is wrong about. As value investor Benjamin Graham famously said, ‘In the short run, the market is a voting machine but in the long run, it is a weighing machine.’ So this free report on the analyst consensus forecasts could help you make a master move on this stock.
Of course you might be able to find a better stock than LendLease Group. So you may wish to see this free collection of other companies that have grown earnings strongly.
We aim to bring you long-term focused research analysis driven by fundamental data. Note that our analysis may not factor in the latest price-sensitive company announcements or qualitative material.
If you spot an error that warrants correction, please contact the editor at editorial-team@simplywallst.com. This article by Simply Wall St is general in nature. It does not constitute a recommendation to buy or sell any stock, and does not take account of your objectives, or your financial situation. Simply Wall St has no position in the stocks mentioned. Thank you for reading.
