Should We Worry About NVE Corporation’s (NASDAQ:NVEC) P/E Ratio?

Want to participate in a short research study? Help shape the future of investing tools and receive a $20 prize!
This article is written for those who want to get better at using price to earnings ratios (P/E ratios). We’ll show how you can use NVE Corporation’s (NASDAQ:NVEC) P/E ratio to inform your assessment of the investment opportunity. NVE has a price to earnings ratio of 32.06, based on the last twelve months. That is equivalent to an earnings yield of about 3.1%.
View our latest analysis for NVE
How Do You Calculate A P/E Ratio?
The formula for price to earnings is:
Price to Earnings Ratio = Share Price ÷ Earnings per Share (EPS)
Or for NVE:
P/E of 32.06 = $102.8 ÷ $3.21 (Based on the year to December 2018.)
Is A High Price-to-Earnings Ratio Good?
A higher P/E ratio means that investors are paying a higher price for each $1 of company earnings. That isn’t a good or a bad thing on its own, but a high P/E means that buyers have a higher opinion of the business’s prospects, relative to stocks with a lower P/E.
How Growth Rates Impact P/E Ratios
Earnings growth rates have a big influence on P/E ratios. That’s because companies that grow earnings per share quickly will rapidly increase the ‘E’ in the equation. That means even if the current P/E is high, it will reduce over time if the share price stays flat. Then, a lower P/E should attract more buyers, pushing the share price up.
It’s great to see that NVE grew EPS by 19% in the last year. And its annual EPS growth rate over 5 years is 3.3%. This could arguably justify a relatively high P/E ratio.
How Does NVE’s P/E Ratio Compare To Its Peers?
The P/E ratio essentially measures market expectations of a company. You can see in the image below that the average P/E (17.7) for companies in the semiconductor industry is lower than NVE’s P/E.
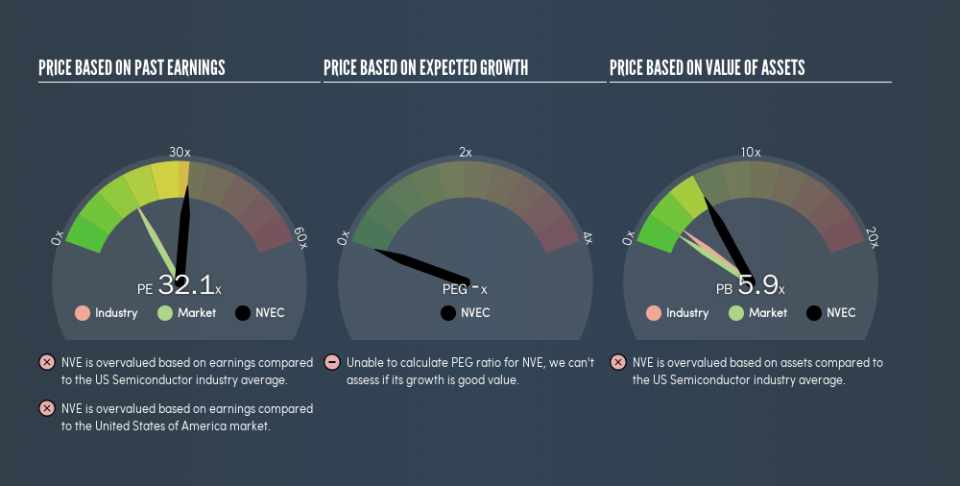
Its relatively high P/E ratio indicates that NVE shareholders think it will perform better than other companies in its industry classification. Shareholders are clearly optimistic, but the future is always uncertain. So investors should delve deeper. I like to check if company insiders have been buying or selling.
Remember: P/E Ratios Don’t Consider The Balance Sheet
Don’t forget that the P/E ratio considers market capitalization. That means it doesn’t take debt or cash into account. Hypothetically, a company could reduce its future P/E ratio by spending its cash (or taking on debt) to achieve higher earnings.
Such expenditure might be good or bad, in the long term, but the point here is that the balance sheet is not reflected by this ratio.
How Does NVE’s Debt Impact Its P/E Ratio?
NVE has net cash of US$24m. That should lead to a higher P/E than if it did have debt, because its strong balance sheets gives it more options.
The Verdict On NVE’s P/E Ratio
NVE’s P/E is 32.1 which is above average (17.5) in the US market. Its net cash position supports a higher P/E ratio, as does its solid recent earnings growth. So it does not seem strange that the P/E is above average.
Investors should be looking to buy stocks that the market is wrong about. If the reality for a company is better than it expects, you can make money by buying and holding for the long term. Although we don’t have analyst forecasts, you could get a better understanding of its growth by checking out this more detailed historical graph of earnings, revenue and cash flow.
But note: NVE may not be the best stock to buy. So take a peek at this free list of interesting companies with strong recent earnings growth (and a P/E ratio below 20).
We aim to bring you long-term focused research analysis driven by fundamental data. Note that our analysis may not factor in the latest price-sensitive company announcements or qualitative material.
If you spot an error that warrants correction, please contact the editor at editorial-team@simplywallst.com. This article by Simply Wall St is general in nature. It does not constitute a recommendation to buy or sell any stock, and does not take account of your objectives, or your financial situation. Simply Wall St has no position in the stocks mentioned. Thank you for reading.
