Should We Worry About The Southern Company’s (NYSE:SO) P/E Ratio?

Want to participate in a research study? Help shape the future of investing tools and earn a $60 gift card!
The goal of this article is to teach you how to use price to earnings ratios (P/E ratios). We’ll look at The Southern Company’s (NYSE:SO) P/E ratio and reflect on what it tells us about the company’s share price. Based on the last twelve months, Southern’s P/E ratio is 23.86. That corresponds to an earnings yield of approximately 4.2%.
View our latest analysis for Southern
How Do You Calculate Southern’s P/E Ratio?
The formula for price to earnings is:
Price to Earnings Ratio = Price per Share ÷ Earnings per Share (EPS)
Or for Southern:
P/E of 23.86 = $52.05 ÷ $2.18 (Based on the trailing twelve months to December 2018.)
Is A High Price-to-Earnings Ratio Good?
A higher P/E ratio implies that investors pay a higher price for the earning power of the business. That isn’t necessarily good or bad, but a high P/E implies relatively high expectations of what a company can achieve in the future.
How Growth Rates Impact P/E Ratios
Companies that shrink earnings per share quickly will rapidly decrease the ‘E’ in the equation. That means even if the current P/E is low, it will increase over time if the share price stays flat. So while a stock may look cheap based on past earnings, it could be expensive based on future earnings.
Southern increased earnings per share by a whopping 159% last year. Unfortunately, earnings per share are down 7.1% a year, over 5 years.
How Does Southern’s P/E Ratio Compare To Its Peers?
We can get an indication of market expectations by looking at the P/E ratio. The image below shows that Southern has a P/E ratio that is roughly in line with the electric utilities industry average (22.3).
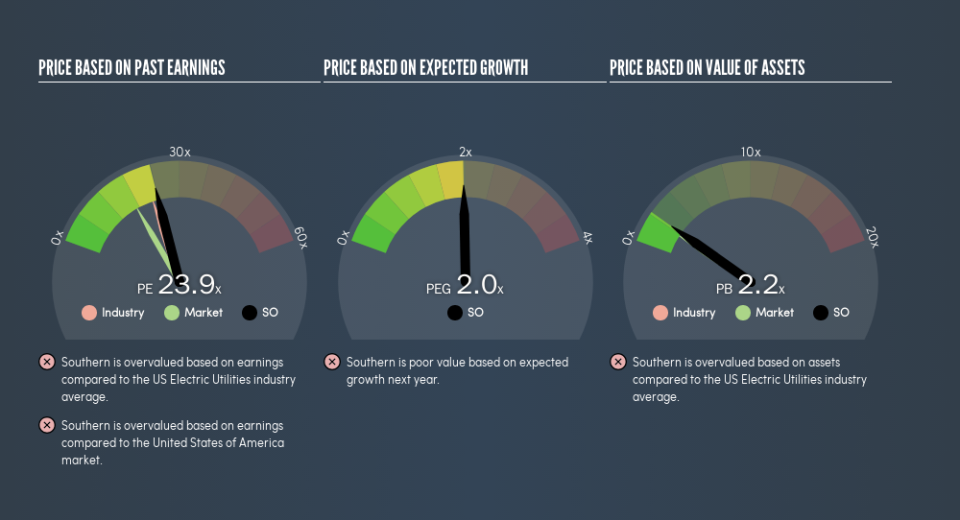
Southern’s P/E tells us that market participants think its prospects are roughly in line with its industry. If the company has better than average prospects, then the market might be underestimating it. Checking factors such as the tenure of the board and management could help you form your own view on if that will happen.
Don’t Forget: The P/E Does Not Account For Debt or Bank Deposits
It’s important to note that the P/E ratio considers the market capitalization, not the enterprise value. That means it doesn’t take debt or cash into account. Hypothetically, a company could reduce its future P/E ratio by spending its cash (or taking on debt) to achieve higher earnings.
Spending on growth might be good or bad a few years later, but the point is that the P/E ratio does not account for the option (or lack thereof).
Is Debt Impacting Southern’s P/E?
Southern has net debt worth 84% of its market capitalization. This is a reasonably significant level of debt — all else being equal you’d expect a much lower P/E than if it had net cash.
The Verdict On Southern’s P/E Ratio
Southern trades on a P/E ratio of 23.9, which is above the US market average of 17.2. It’s good to see the recent earnings growth, although we note the company uses debt already. The relatively high P/E ratio suggests shareholders think growth will continue.
When the market is wrong about a stock, it gives savvy investors an opportunity. If the reality for a company is better than it expects, you can make money by buying and holding for the long term. So this free visual report on analyst forecasts could hold the key to an excellent investment decision.
But note: Southern may not be the best stock to buy. So take a peek at this free list of interesting companies with strong recent earnings growth (and a P/E ratio below 20).
We aim to bring you long-term focused research analysis driven by fundamental data. Note that our analysis may not factor in the latest price-sensitive company announcements or qualitative material.
If you spot an error that warrants correction, please contact the editor at editorial-team@simplywallst.com. This article by Simply Wall St is general in nature. It does not constitute a recommendation to buy or sell any stock, and does not take account of your objectives, or your financial situation. Simply Wall St has no position in the stocks mentioned. Thank you for reading.
