Should We Worry About Wm Morrison Supermarkets PLC’s (LON:MRW) P/E Ratio?

This article is written for those who want to get better at using price to earnings ratios (P/E ratios). To keep it practical, we’ll show how Wm Morrison Supermarkets PLC’s (LON:MRW) P/E ratio could help you assess the value on offer. Based on the last twelve months, Wm Morrison Supermarkets’s P/E ratio is 22.63. That is equivalent to an earnings yield of about 4.4%.
View our latest analysis for Wm Morrison Supermarkets
How Do I Calculate A Price To Earnings Ratio?
The formula for P/E is:
Price to Earnings Ratio = Share Price ÷ Earnings per Share (EPS)
Or for Wm Morrison Supermarkets:
P/E of 22.63 = £2.35 ÷ £0.10 (Based on the trailing twelve months to August 2018.)
Is A High P/E Ratio Good?
A higher P/E ratio means that buyers have to pay a higher price for each £1 the company has earned over the last year. All else being equal, it’s better to pay a low price — but as Warren Buffett said, ‘It’s far better to buy a wonderful company at a fair price than a fair company at a wonderful price.’
How Growth Rates Impact P/E Ratios
P/E ratios primarily reflect market expectations around earnings growth rates. When earnings grow, the ‘E’ increases, over time. Therefore, even if you pay a high multiple of earnings now, that multiple will become lower in the future. Then, a lower P/E should attract more buyers, pushing the share price up.
Wm Morrison Supermarkets’s earnings per share fell by 32% in the last twelve months. But over the longer term (5 years) earnings per share have increased by 34%.
How Does Wm Morrison Supermarkets’s P/E Ratio Compare To Its Peers?
We can get an indication of market expectations by looking at the P/E ratio. The image below shows that Wm Morrison Supermarkets has a higher P/E than the average (19) P/E for companies in the consumer retailing industry.
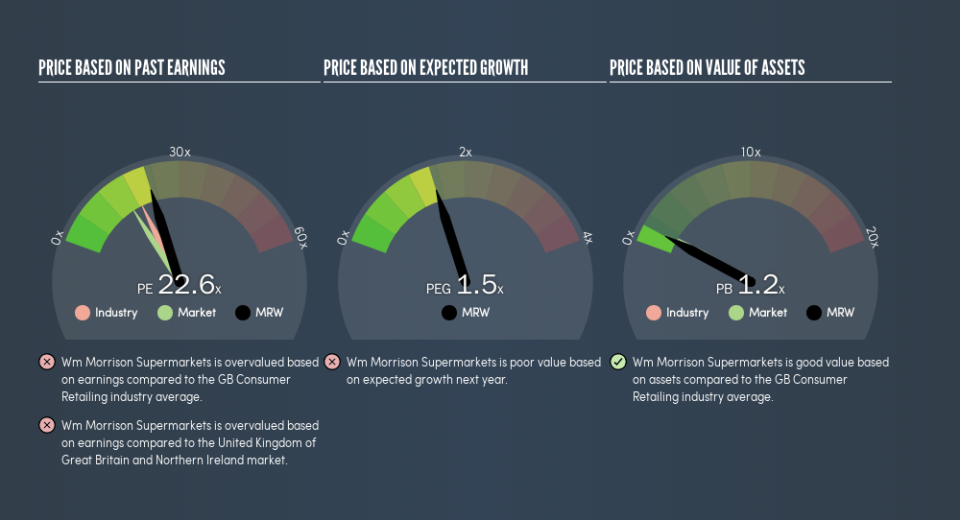
That means that the market expects Wm Morrison Supermarkets will outperform other companies in its industry. Clearly the market expects growth, but it isn’t guaranteed. So investors should delve deeper. I like to check if company insiders have been buying or selling.
Don’t Forget: The P/E Does Not Account For Debt or Bank Deposits
It’s important to note that the P/E ratio considers the market capitalization, not the enterprise value. That means it doesn’t take debt or cash into account. In theory, a company can lower its future P/E ratio by using cash or debt to invest in growth.
Spending on growth might be good or bad a few years later, but the point is that the P/E ratio does not account for the option (or lack thereof).
Is Debt Impacting Wm Morrison Supermarkets’s P/E?
Wm Morrison Supermarkets has net debt worth 18% of its market capitalization. This could bring some additional risk, and reduce the number of investment options for management; worth remembering if you compare its P/E to businesses without debt.
The Verdict On Wm Morrison Supermarkets’s P/E Ratio
Wm Morrison Supermarkets trades on a P/E ratio of 22.6, which is above the GB market average of 16.1. With some debt but no EPS growth last year, the market has high expectations of future profits.
Investors have an opportunity when market expectations about a stock are wrong. As value investor Benjamin Graham famously said, ‘In the short run, the market is a voting machine but in the long run, it is a weighing machine.’ So this free visual report on analyst forecasts could hold the key to an excellent investment decision.
Of course, you might find a fantastic investment by looking at a few good candidates. So take a peek at this free list of companies with modest (or no) debt, trading on a P/E below 20.
We aim to bring you long-term focused research analysis driven by fundamental data. Note that our analysis may not factor in the latest price-sensitive company announcements or qualitative material.
If you spot an error that warrants correction, please contact the editor at editorial-team@simplywallst.com. This article by Simply Wall St is general in nature. It does not constitute a recommendation to buy or sell any stock, and does not take account of your objectives, or your financial situation. Simply Wall St has no position in the stocks mentioned. Thank you for reading.
