WTI Crude Oil Daily Analysis – July 17, 2017
Oil prices are trading slightly higher on Monday morning to continue last week’s trend. The bullish sentiment is an outcome of high demand and the rise of U.S. oil production.
According to Baker Hughes, the total count rose to 765 after U.S. drillers added two oil rigs in the week of July 14.
Technical Outlook
Crude oil prices closed nearby the resistance at $46.54, and the next resistance can be expected at $47.36 which was the previous high. Crude oil is currently trading at $46.77 a barrel, +0.48%.
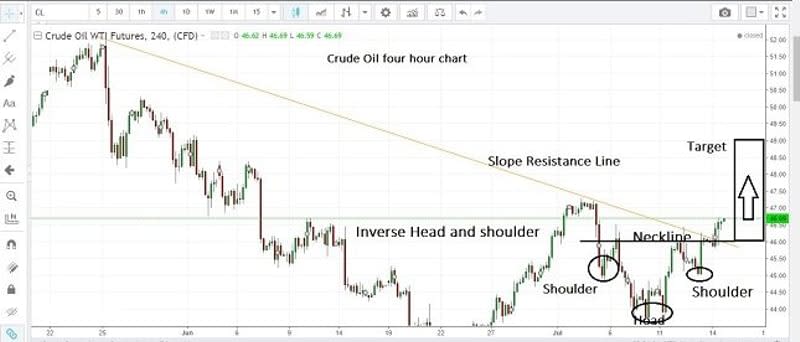
Crude oil 4H chart has formed the “Inverse Head and shoulder” pattern which could be interpreted as a bullish trend. Crude oil prices broke above the neckline and the next target will be at $47.50-$49 levels.
There was a price consolidation above the neckline which we commonly define as ‘junction point’. This indicates traders indecision, however, once prices broke above the consolidated area, the momentum has turned to be bullish.
This article was originally posted on FX Empire
