WTI Crude Oil Daily Analysis – December 5, 2017
Oil prices dipped lower on Monday and continue to trade lower on Tuesday morning as traders take profit back of the recent rally as their focus shifts to the U.S crude output.
According to an EIA report last week, U.S. output rose in September to 9.5 million barrels per day (bpd), the highest monthly output since 2015.
Sentiment on oil prices, however, remained bullish amid expectations that rebalancing in markets will continue after OPEC and some non-OPEC producers meeting last Thursday in Vienna, Austria. The members decided to continue the cut supply by 1.8 million barrels per day (bpd) until the end of 2018.
Technical view
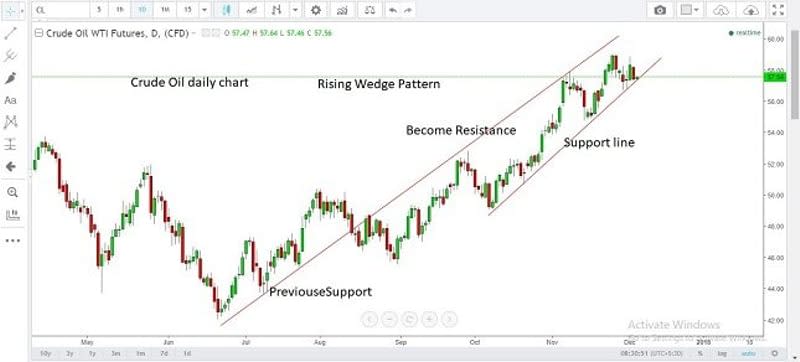
Crude oil daily chart seems to continue in the same “Rising wedge” pattern which also indicates that market is still in an uptrend.

As of the last session, prices hit the support line of the channel and climbed back up. Currently, the market has broken the support line and continues in bearish momentum. It can extend towards $57 level. Resistance holds at $59.
This article was originally posted on FX Empire
