Wynn Resorts' (WYNN) Q1 Earnings & Revenues Top Estimates
Wynn Resorts, Limited WYNN reported impressive first-quarter 2023 results, with earnings and revenues surpassing the Zacks Consensus Estimate. Also, the top and bottom lines grew year over year.
Craig Billings, CEO of Wynn Resorts, Limited, stated, "For the first time in over three years, each of our resorts is generating strong financial results, which is once again a testament to our team's relentless focus on delivering five-star hospitality and experiences to our guests. In Macau, after several challenging years, we were pleased to experience a meaningful return of visitation and demand, particularly in our mass gaming and retail businesses. We believe we are well-positioned for success in Macau's next phase of growth.”
Q1 Earnings & Revenues
During the quarter, the company reported adjusted earnings of 29 cents per share against the Zacks Consensus Estimate of a loss of 18 cents. In the prior-year quarter, the company reported an adjusted loss of $1.21 per share.
Wynn Resorts, Limited Price, Consensus and EPS Surprise
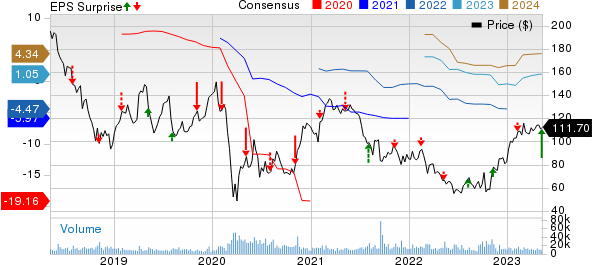
Wynn Resorts, Limited price-consensus-eps-surprise-chart | Wynn Resorts, Limited Quote
Quarterly revenues of $1,423.7 million surpassed the consensus mark of $1,254 million by 13.5%. Also, the top line increased 49.3% on a year-over-year basis. The upside was mainly attributed to high contributions from all its operating segments along with a rise in gaming volumes, hotel occupancy, and covers at restaurants.
Wynn Palace Operations
During the first quarter of 2023, Wynn Palace’s operating revenues were $369.4 million compared with $163.3 million reported in the prior-year quarter. Casino revenues in the reported quarter totaled $270.7 million compared with $114.4 million reported in the prior-year quarter. Rooms, and food and beverage revenues surged 239.2% and 105.8% year over year to $46.9 million and $23.6 million, respectively. During the quarter under review, entertainment, retail and other revenues increased 19.4% year over year to $28.2 million.
In the VIP segment, table games turnover was $ 2,293.4 million, up 137.5% year over year. VIP table games win (loss) rate (based on turnover) was 2.72%, up from 2.05% reported in the prior-year quarter. Table drop in the mass market segment was $1,182 million compared with $531.9 million reported in the prior-year quarter. Table games wins in mass market operations amounted to $260.9 million compared with $111.2 million reported in the prior-year quarter.
During the reported quarter, RevPAR increased 231.8% year over year to $282. Occupancy levels in the segment came in at 88.1% compared with 47.2% reported in the prior-year quarter. The average daily rate (ADR) during the quarter came in at $321, up 78.3% on a year-over-year basis.
Wynn Macau Operations
During the first quarter, Wynn Macau’s operating revenues amounted to $230.7 million compared with $135.1 million reported in the prior-year quarter. The upside was primarily attributed to the increase in casino, rooms and entertainment, retail and other revenues.
Casino revenues in the reported quarter were $176.4 million, up 72.2% year over year. Rooms, and entertainment, and retail and other revenues grew 134% and 21.3% year over year to $22 million and $18.1 million, respectively. During the quarter, food and beverage revenues increased 70.5% year over year to $14.3 million.
Table games turnover in the VIP segment increased 29% year over year to $1,144.2 million. The VIP table games win rate (based on turnover) was 2.69%, lower than 3.84% reported in the prior-year quarter.
Table drop in the mass market segment was $990 million compared with $469.1 million reported in the prior-year quarter. Table games win in the mass market category was $168.4 million compared with $82.3 million reported in the prior-year quarter.
During the reported quarter, RevPAR grew 134% year over year to $220. Occupancy levels in the segment came in at 90.9% compared with 49.8% in the prior-year quarter. Also, ADR came in at $242, up 28.7% year over year.
Las Vegas Operations
During the first quarter, operating revenues from Las Vegas operations were $586.8 million compared with $441.2 million reported in the year-ago quarter.
Casino revenues increased 24.3% year over year to $154.5 million. Revenues from food and beverage, rooms and entertainment, retail and other increased 26.8%, 40.8% and 51% year over year to $172.5 million, $185.1 million and $74.6 million, respectively.
Table games drop was up 9.6% year over year to $600.7 million. Table games wins increased 13% year over year to $146 million. During the first quarter, table games win percentage of 24.3% was above 23.6% reported in the prior-year quarter.
During the quarter under review, RevPAR increased 31.5% year over year to $438. The occupancy rate came in at 88.8%, up from 76.9% reported in the prior-year quarter. ADR was $493, up 14.1% year over year.
Encore Boston Harbor
During the first quarter, operating revenues from Encore Boston Harbor operations amounted to $216.3 million compared with $190.8 million reported in the prior-year quarter. Revenues from rooms, food and beverage, and entertainment, retail and other increased 18.2%, 22.6% and 23.2% year over year to $18.5 million, $22.3 million and $10.1 million, respectively.
During the quarter, table games win percentage of 21.7% was below 22.2% reported in the prior-year quarter.
During the reported quarter, RevPAR increased 18.4% year over year to $309. The occupancy rate came in at 90%, up from 80.5% reported in the prior-year quarter. ADR was $343, up 5.9% year over year.
Operating Performance
During the first quarter of 2023 adjusted property EBITDAR was $429.7 million compared with $177.6 million reported in the prior-year quarter.
In the quarter under review, adjusted property EBITDAR from Wynn Macau totaled $44.7 million compared with ($4,682) million reported in the prior-year quarter. Adjusted property EBITDAR from Las Vegas operations was $231.6 million compared with $159.4 million reported in the year-ago quarter. Adjusted property EBITDAR from Encore Boston Harbor was $63.4 million compared with $55.3 million reported in the prior-year quarter.
Cash Position
As of Mar 31, 2023, Wynn Resorts’ cash and cash equivalents totaled $3.84 billion compared with $3.65 billion as of 2022-end.
Total current and outstanding debt at the end of first-quarter 2023 amounted to $12.25 billion. The figure included $2.64 billion of Wynn Las Vegas-related debt, $6.75 billion of Macau debt, $2.25 billion of Wynn Resorts Finance debt and $613.6 million of debt held by the retail joint venture, which the company consolidated.
Zacks Rank & Other Key Picks
WYNN currently carries a Zacks Rank #2 (Buy). You can see the complete list of today’s Zacks #1 Rank (Strong Buy) stocks here.
Here are some other top-ranked stocks from the Zacks Consumer Discretionary sector.
PlayAGS, Inc. AGS carries a Zacks Rank #1. AGS has a trailing four-quarter earnings surprise of 155.2%, on average. The stock of the company has declined 9.6% in the past six months.
The Zacks Consensus Estimate for AGS 2023 sales indicates a rise of 5.6%, from the year-ago period’s levels.
Boyd Gaming Corporation BYD currently has a Zacks Rank #2. BYD has a trailing four-quarter earnings surprise of 13.7%, on average. Shares of the company have increased 19.7% in the past six months.
The Zacks Consensus Estimate for BYD’s 2023 sales and EPS indicates a rise of 1.9% and 2.6%, respectively, from the year-ago period’s levels.
Crocs, Inc. CROX carries a Zacks Rank #2. CROX has a trailing four-quarter earnings surprise of 19.6%, on average. Shares of the company have increased 25.3% in the past six months.
The Zacks Consensus Estimate for CROX’s 2023 sales and EPS indicates a rise of 13% and 5.6%, respectively, from the year-ago period’s levels.
Want the latest recommendations from Zacks Investment Research? Today, you can download 7 Best Stocks for the Next 30 Days. Click to get this free report
Wynn Resorts, Limited (WYNN) : Free Stock Analysis Report
Boyd Gaming Corporation (BYD) : Free Stock Analysis Report
Crocs, Inc. (CROX) : Free Stock Analysis Report
PlayAGS, Inc. (AGS) : Free Stock Analysis Report
