Is Xiwang Special Steel Company Limited's (HKG:1266) P/E Ratio Really That Good?

The goal of this article is to teach you how to use price to earnings ratios (P/E ratios). To keep it practical, we'll show how Xiwang Special Steel Company Limited's (HKG:1266) P/E ratio could help you assess the value on offer. Looking at earnings over the last twelve months, Xiwang Special Steel has a P/E ratio of 3.03. That corresponds to an earnings yield of approximately 33%.
View our latest analysis for Xiwang Special Steel
How Do I Calculate A Price To Earnings Ratio?
The formula for price to earnings is:
Price to Earnings Ratio = Price per Share (in the reporting currency) ÷ Earnings per Share (EPS)
Or for Xiwang Special Steel:
P/E of 3.03 = CN¥0.77 (Note: this is the share price in the reporting currency, namely, CNY ) ÷ CN¥0.25 (Based on the trailing twelve months to June 2019.)
Is A High P/E Ratio Good?
A higher P/E ratio implies that investors pay a higher price for the earning power of the business. That isn't a good or a bad thing on its own, but a high P/E means that buyers have a higher opinion of the business's prospects, relative to stocks with a lower P/E.
How Does Xiwang Special Steel's P/E Ratio Compare To Its Peers?
The P/E ratio essentially measures market expectations of a company. If you look at the image below, you can see Xiwang Special Steel has a lower P/E than the average (10.4) in the metals and mining industry classification.
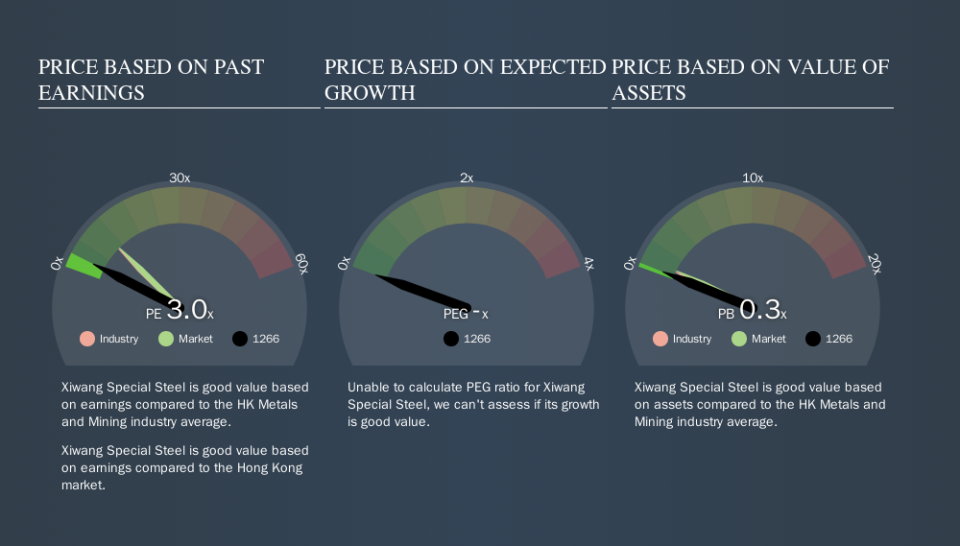
This suggests that market participants think Xiwang Special Steel will underperform other companies in its industry. While current expectations are low, the stock could be undervalued if the situation is better than the market assumes. It is arguably worth checking if insiders are buying shares, because that might imply they believe the stock is undervalued.
How Growth Rates Impact P/E Ratios
P/E ratios primarily reflect market expectations around earnings growth rates. Earnings growth means that in the future the 'E' will be higher. And in that case, the P/E ratio itself will drop rather quickly. A lower P/E should indicate the stock is cheap relative to others -- and that may attract buyers.
Xiwang Special Steel saw earnings per share decrease by 53% last year. But EPS is up 4.6% over the last 5 years.
A Limitation: P/E Ratios Ignore Debt and Cash In The Bank
The 'Price' in P/E reflects the market capitalization of the company. Thus, the metric does not reflect cash or debt held by the company. Theoretically, a business can improve its earnings (and produce a lower P/E in the future) by investing in growth. That means taking on debt (or spending its cash).
Such spending might be good or bad, overall, but the key point here is that you need to look at debt to understand the P/E ratio in context.
How Does Xiwang Special Steel's Debt Impact Its P/E Ratio?
Xiwang Special Steel has net debt worth a very significant 228% of its market capitalization. If you want to compare its P/E ratio to other companies, you must keep in mind that these debt levels would usually warrant a relatively low P/E.
The Verdict On Xiwang Special Steel's P/E Ratio
Xiwang Special Steel trades on a P/E ratio of 3, which is below the HK market average of 10.7. When you consider that the company has significant debt, and didn't grow EPS last year, it isn't surprising that the market has muted expectations.
Investors have an opportunity when market expectations about a stock are wrong. If the reality for a company is not as bad as the P/E ratio indicates, then the share price should increase as the market realizes this. We don't have analyst forecasts, but shareholders might want to examine this detailed historical graph of earnings, revenue and cash flow.
You might be able to find a better buy than Xiwang Special Steel. If you want a selection of possible winners, check out this free list of interesting companies that trade on a P/E below 20 (but have proven they can grow earnings).
We aim to bring you long-term focused research analysis driven by fundamental data. Note that our analysis may not factor in the latest price-sensitive company announcements or qualitative material.
If you spot an error that warrants correction, please contact the editor at editorial-team@simplywallst.com. This article by Simply Wall St is general in nature. It does not constitute a recommendation to buy or sell any stock, and does not take account of your objectives, or your financial situation. Simply Wall St has no position in the stocks mentioned. Thank you for reading.
