XP Power Limited (LON:XPP) Stock's Been Sliding But Fundamentals Look Decent: Will The Market Correct The Share Price In The Future?
XP Power (LON:XPP) has had a rough three months with its share price down 16%. However, stock prices are usually driven by a company’s financials over the long term, which in this case look pretty respectable. In this article, we decided to focus on XP Power's ROE.
Return on Equity or ROE is a test of how effectively a company is growing its value and managing investors’ money. In simpler terms, it measures the profitability of a company in relation to shareholder's equity.
Check out our latest analysis for XP Power
How Do You Calculate Return On Equity?
Return on equity can be calculated by using the formula:
Return on Equity = Net Profit (from continuing operations) ÷ Shareholders' Equity
So, based on the above formula, the ROE for XP Power is:
13% = UK£23m ÷ UK£172m (Based on the trailing twelve months to December 2021).
The 'return' refers to a company's earnings over the last year. One way to conceptualize this is that for each £1 of shareholders' capital it has, the company made £0.13 in profit.
What Is The Relationship Between ROE And Earnings Growth?
Thus far, we have learned that ROE measures how efficiently a company is generating its profits. We now need to evaluate how much profit the company reinvests or "retains" for future growth which then gives us an idea about the growth potential of the company. Assuming everything else remains unchanged, the higher the ROE and profit retention, the higher the growth rate of a company compared to companies that don't necessarily bear these characteristics.
XP Power's Earnings Growth And 13% ROE
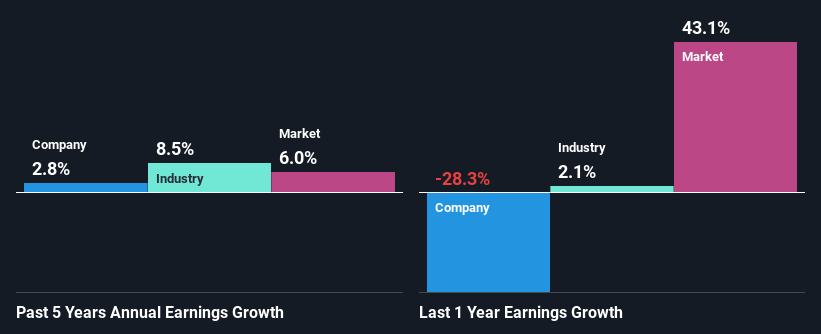
To start with, XP Power's ROE looks acceptable. Further, the company's ROE is similar to the industry average of 13%. Despite the modest returns, XP Power's five year net income growth was quite low, averaging at only 2.8%. We reckon that a low growth, when returns are moderate could be the result of certain circumstances like low earnings retention or poor allocation of capital.
Next, on comparing with the industry net income growth, we found that XP Power's reported growth was lower than the industry growth of 8.5% in the same period, which is not something we like to see.
Earnings growth is an important metric to consider when valuing a stock. What investors need to determine next is if the expected earnings growth, or the lack of it, is already built into the share price. Doing so will help them establish if the stock's future looks promising or ominous. Has the market priced in the future outlook for XPP? You can find out in our latest intrinsic value infographic research report.
Is XP Power Making Efficient Use Of Its Profits?
With a high three-year median payout ratio of 51% (or a retention ratio of 49%), most of XP Power's profits are being paid to shareholders. This definitely contributes to the low earnings growth seen by the company.
Additionally, XP Power has paid dividends over a period of at least ten years, which means that the company's management is determined to pay dividends even if it means little to no earnings growth. Based on the latest analysts' estimates, we found that the company's future payout ratio over the next three years is expected to hold steady at 47%. Regardless, the future ROE for XP Power is predicted to rise to 24% despite there being not much change expected in its payout ratio.
Summary
In total, it does look like XP Power has some positive aspects to its business. However, while the company does have a high ROE, its earnings growth number is quite disappointing. This can be blamed on the fact that it reinvests only a small portion of its profits and pays out the rest as dividends. Having said that, looking at the current analyst estimates, we found that the company's earnings are expected to gain momentum. Are these analysts expectations based on the broad expectations for the industry, or on the company's fundamentals? Click here to be taken to our analyst's forecasts page for the company.
Have feedback on this article? Concerned about the content? Get in touch with us directly. Alternatively, email editorial-team (at) simplywallst.com.
This article by Simply Wall St is general in nature. We provide commentary based on historical data and analyst forecasts only using an unbiased methodology and our articles are not intended to be financial advice. It does not constitute a recommendation to buy or sell any stock, and does not take account of your objectives, or your financial situation. We aim to bring you long-term focused analysis driven by fundamental data. Note that our analysis may not factor in the latest price-sensitive company announcements or qualitative material. Simply Wall St has no position in any stocks mentioned.
Join A Paid User Research Session
You’ll receive a US$30 Amazon Gift card for 1 hour of your time while helping us build better investing tools for the individual investors like yourself. Sign up here
