What Is Zijin Mining Group's (HKG:2899) P/E Ratio After Its Share Price Rocketed?

Zijin Mining Group (HKG:2899) shares have continued recent momentum with a 32% gain in the last month alone. And the full year gain of 43% isn't too shabby, either!
All else being equal, a sharp share price increase should make a stock less attractive to potential investors. In the long term, share prices tend to follow earnings per share, but in the short term prices bounce around in response to short term factors (which are not always obvious). The implication here is that deep value investors might steer clear when expectations of a company are too high. Perhaps the simplest way to get a read on investors' expectations of a business is to look at its Price to Earnings Ratio (PE Ratio). A high P/E implies that investors have high expectations of what a company can achieve compared to a company with a low P/E ratio.
Check out our latest analysis for Zijin Mining Group
How Does Zijin Mining Group's P/E Ratio Compare To Its Peers?
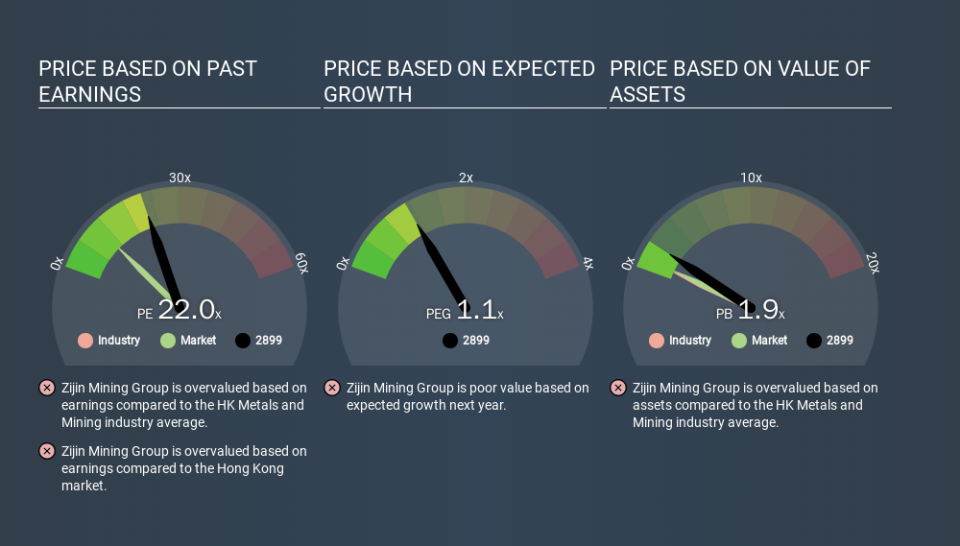
Zijin Mining Group's P/E of 21.95 indicates some degree of optimism towards the stock. As you can see below, Zijin Mining Group has a higher P/E than the average company (10.6) in the metals and mining industry.
Its relatively high P/E ratio indicates that Zijin Mining Group shareholders think it will perform better than other companies in its industry classification. The market is optimistic about the future, but that doesn't guarantee future growth. So investors should delve deeper. I like to check if company insiders have been buying or selling.
How Growth Rates Impact P/E Ratios
Generally speaking the rate of earnings growth has a profound impact on a company's P/E multiple. When earnings grow, the 'E' increases, over time. And in that case, the P/E ratio itself will drop rather quickly. So while a stock may look expensive based on past earnings, it could be cheap based on future earnings.
Zijin Mining Group saw earnings per share decrease by 21% last year. But EPS is up 8.9% over the last 5 years.
A Limitation: P/E Ratios Ignore Debt and Cash In The Bank
Don't forget that the P/E ratio considers market capitalization. So it won't reflect the advantage of cash, or disadvantage of debt. Hypothetically, a company could reduce its future P/E ratio by spending its cash (or taking on debt) to achieve higher earnings.
Such spending might be good or bad, overall, but the key point here is that you need to look at debt to understand the P/E ratio in context.
Zijin Mining Group's Balance Sheet
Zijin Mining Group's net debt equates to 32% of its market capitalization. You'd want to be aware of this fact, but it doesn't bother us.
The Bottom Line On Zijin Mining Group's P/E Ratio
Zijin Mining Group trades on a P/E ratio of 22.0, which is above its market average of 10.6. With a bit of debt, but a lack of recent growth, it's safe to say the market is expecting improved profit performance from the company, in the next few years. What we know for sure is that investors have become much more excited about Zijin Mining Group recently, since they have pushed its P/E ratio from 16.7 to 22.0 over the last month. If you like to buy stocks that have recently impressed the market, then this one might be a candidate; but if you prefer to invest when there is 'blood in the streets', then you may feel the opportunity has passed.
Investors should be looking to buy stocks that the market is wrong about. People often underestimate remarkable growth -- so investors can make money when fast growth is not fully appreciated. So this free visual report on analyst forecasts could hold the key to an excellent investment decision.
Of course you might be able to find a better stock than Zijin Mining Group. So you may wish to see this free collection of other companies that have grown earnings strongly.
If you spot an error that warrants correction, please contact the editor at editorial-team@simplywallst.com. This article by Simply Wall St is general in nature. It does not constitute a recommendation to buy or sell any stock, and does not take account of your objectives, or your financial situation. Simply Wall St has no position in the stocks mentioned.
We aim to bring you long-term focused research analysis driven by fundamental data. Note that our analysis may not factor in the latest price-sensitive company announcements or qualitative material. Thank you for reading.
