Is Zion Oil & Gas Inc’s (NASDAQ:ZN) Balance Sheet Strong Enough To Weather A Storm?

While small-cap stocks, such as Zion Oil & Gas Inc (NASDAQ:ZN) with its market cap of US$236.15M, are popular for their explosive growth, investors should also be aware of their balance sheet to judge whether the company can survive a downturn. Companies operating in the Oil and Gas industry, especially ones that are currently loss-making, are more likely to be higher risk. Evaluating financial health as part of your investment thesis is crucial. Here are a few basic checks that are good enough to have a broad overview of the company’s financial strength. Nevertheless, given that I have not delve into the company-specifics, I recommend you dig deeper yourself into ZN here.
How does ZN’s operating cash flow stack up against its debt?
ZN’s debt levels surged from US$1.83M to US$2.04M over the last 12 months , which is made up of current and long term debt. With this increase in debt, ZN currently has US$6.89M remaining in cash and short-term investments for investing into the business. Moving onto cash from operations, its trivial cash flows from operations make the cash-to-debt ratio less useful to us, though these low levels of cash means that operational efficiency is worth a look. As the purpose of this article is a high-level overview, I won’t be looking at this today, but you can examine some of ZN’s operating efficiency ratios such as ROA here.
Can ZN pay its short-term liabilities?
Looking at ZN’s most recent US$6.79M liabilities, it seems that the business has been able to meet these commitments with a current assets level of US$10.43M, leading to a 1.54x current account ratio. For Oil and Gas companies, this ratio is within a sensible range since there’s sufficient cash cushion without leaving too much capital idle or in low-earning investments.
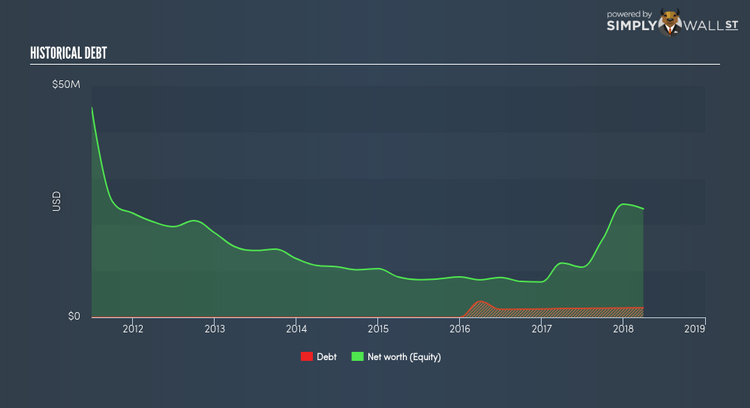
Does ZN face the risk of succumbing to its debt-load?
ZN’s level of debt is low relative to its total equity, at 8.76%. This range is considered safe as ZN is not taking on too much debt obligation, which may be constraining for future growth. Risk around debt is extremely low for ZN, and the company also has the ability and headroom to increase debt if needed going forward.
Next Steps:
ZN’s low debt is also met with low coverage. This indicates room for improvement as its cash flow covers less than a quarter of its borrowings, which means its operating efficiency could be better. However, the company exhibits proper management of current assets and upcoming liabilities. I admit this is a fairly basic analysis for ZN’s financial health. Other important fundamentals need to be considered alongside. I recommend you continue to research Zion Oil & Gas to get a better picture of the stock by looking at:
Historical Performance: What has ZN’s returns been like over the past? Go into more detail in the past track record analysis and take a look at the free visual representations of our analysis for more clarity.
Other High-Performing Stocks: Are there other stocks that provide better prospects with proven track records? Explore our free list of these great stocks here.
To help readers see pass the short term volatility of the financial market, we aim to bring you a long-term focused research analysis purely driven by fundamental data. Note that our analysis does not factor in the latest price sensitive company announcements.
The author is an independent contributor and at the time of publication had no position in the stocks mentioned.
