This chart shows all you need to know about the S&P this week
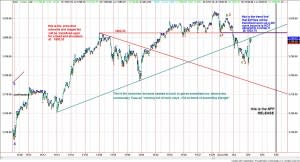
William Blount, veteran trader and our daily voice of humor and wisdom in the Trading Room sent this chart mid-morning with a technical look at the S&P 500 (SPY:NYSEArca), leading up to the release of Non-farm Payroll on Friday.
William has drawn several lines marking several points of interest, from the points of view of trend followers, Elliot Wave afficionados, and chart traders who use patterns like the head and shoulders top and the ascending wedges and triangles.
William is a Renaissance man and I’ve had conversations with him which range from barbecue, US history, Bible references followed by, to my delight, his apt quotation of the Bhagavad Gita.
As such, he looks at a chart and sees the central thread of the narrative amid all the different methods and styles. He’s busy trading at the moment, and just sent this chart without commentary, so let me see if I can decipher it for you. There’s a lot more than meets the eye.
Edwards & Magee
On the left you see “Edwards and Magee,” a reference to the Bible of Technical Analysis, Technical Analysis of Stock Trends, by Robert D. Edwards and John Magee. This 1948 landmark book, now in its 10th edition, “still towers over the discipline of technical analysis like a mighty redwood,” as Amazon puts it. They were the first to teach the “head and shoulders” formation to a wide audience. This book is a must for every trader’s library. If you’re serious about this business, give yourself this book as a holiday gift. William points out that if you use such formations, you are probably starting to get bearish about the S&P 500 and looking for the right shoulder to form where the 1802.33 line is. If it forms and then breaks down, it’s a good place to start trading the downside or exiting longs.
Elliot Wave
Those who are serious about Elliot Wave theory are very strict about the rules. Wave #4, which may now be forming, cannot just go up “some” or top out at “1803-ish.” It has to stop at or below 1802.76. With enough EWites trading, it is not unheard of that an uptrend might stop right at 1802.75. It is a level of resistance even if you don’t use Elliot Wave.
Or just a plain old trendline
My own method goes by the acronym S.T.I.F.F., in which the S stands for Support & Resistance and the T stands for Trendlines. While the S&P did break below that line, there is a long history of higher highs and higher lows, plus other trendlines which are still holding up. Those of us who still think the market will go to 1850 after taking a deep breath will be watching for a clear move back above the line. If the S&P does that and moves above 1810, it will mean a resumption of the uptrend.
The place to go to trade alongside William Blount, Frank Ochoa, Kathy Garber, Jack Broz, and our other professional trader/educators is the MrTopStep IM-Pro Trading Room. We have another one-week introductory boot camp from December 13-19. Past boot camps have been very well received and a lot of pros as well as serious students from beginners to advanced have decided to join what we think is the best trading room in the business. Plus, you get the MiM for free.
