Dollar Rally Takes a Break, S&P 500 Threatens Bearish Setup
THE TAKEAWAY: The US Dollar is aiming to set another three-year high while recent S&P 500 gains continue to look corrective in the context of a larger decline.
Capitalize on Shifts in Market Mood with the DailyFX Speculative Sentiment Index.
US DOLLAR TECHNICAL ANALYSIS – Prices broke above resistance at 10946, the 100% Fibonacci expansion, opening the door for a move higher to challenge the 123.6% level at 11016. The 10946 mark has been recast as near-term support. A reversal back beneath that aims for the 10848-77 area marking the late-May swing top.
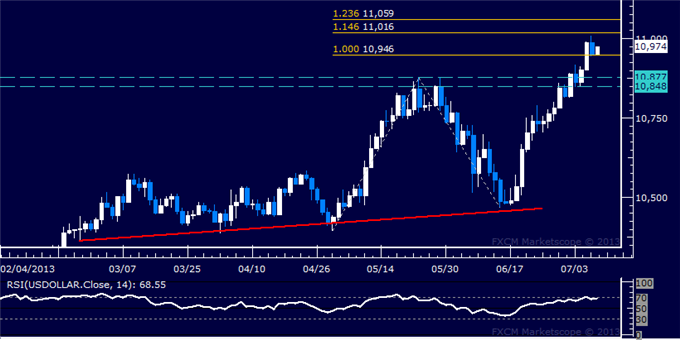
Daily Chart - Created Using FXCM Marketscope 2.0
S&P 500 TECHNICAL ANALYSIS – Prices moved higher as expected after putting in a bullish Piercing Line candlestick pattern. A move above the 61.8% Fibonacci retracement at 1638.40 has exposed support-turned-resistance at a rising trend line set from mid-November 2012, now at 1645.30. A further push above that aims for the 76.4% level at 1657.10. Alternatively, a move back beneath 1638.40 targets the 50% mark at 1623.30.
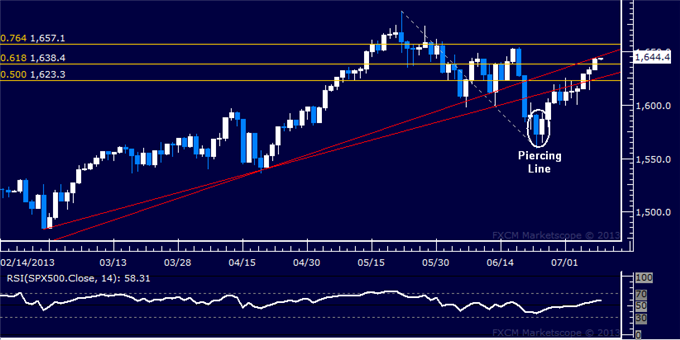
Daily Chart - Created Using FXCM Marketscope 2.0
GOLD TECHNICAL ANALYSIS – Prices turned lower anew, with sellers challenging support marked by the 23.6% Fibonacci expansion at 1209.88. A break beneath that initially targets the 38.2% level at 1174.32. Near-term resistance is at 1267.36, the July 2 swing high.
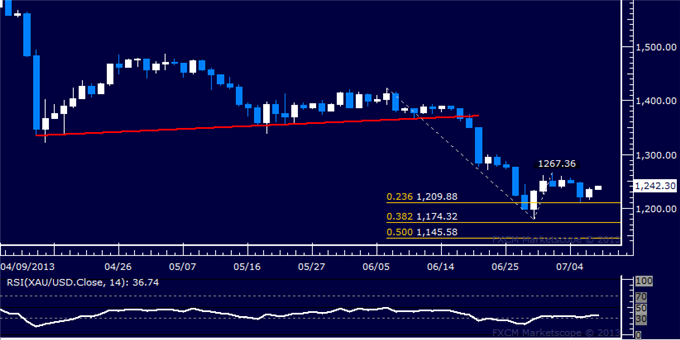
Daily Chart - Created Using FXCM Marketscope 2.0
CRUDE OIL TECHNICAL ANALYSIS– Prices advanced as expected after putting in a bullish Piercing Line candlestick pattern above trend line support. A break above the 78.6% Fibonacci expansion at 103.35 would expose the 100% level at 106.26. Near-term support is at 101.07, the 61.8% Fib, with a break beneath that eyeing the 50% expansion at 99.47.

Daily Chart - Created Using FXCM Marketscope 2.0
--- Written by Ilya Spivak, Currency Strategist for Dailyfx.com
To contact Ilya, e-mail ispivak@dailyfx.com. Follow Ilya on Twitter at @IlyaSpivak
To be added to Ilya's e-mail distribution list, please CLICK HERE
New to FX? Watch this Video. For live market updates, visit the Real Time News Feed
DailyFX provides forex news and technical analysis on the trends that influence the global currency markets.
Learn forex trading with a free practice account and trading charts from FXCM.
