EUR/USD Technical Analysis: Rally Stalls Before 1.33 Level
EUR/USD Technical Analysis– Prices advanced as expected after putting in a Bullish Engulfing candlestick pattern. The pair has broken above a falling trend line set from early February and the 76.4% Fibonacci expansion (1.3176), exposing the 100% level at 1.3293. A push above that aims for the 123.6% Fib at 1.3411. The 1.3176 level has been recast as near-term support, with a drop back beneath that eyeing the 61.8% expansion at 1.3103.
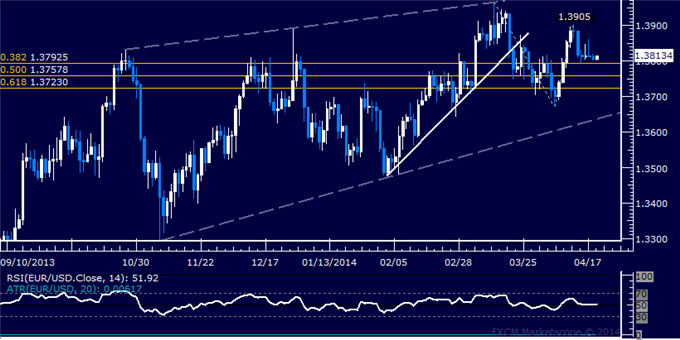
Daily Chart - Created Using FXCM Marketscope 2.0
--- Written by Ilya Spivak, Currency Strategist for Dailyfx.com
To contact Ilya, e-mail ispivak@dailyfx.com. Follow Ilya on Twitter at @IlyaSpivak
To be added to Ilya's e-mail distribution list, please CLICK HERE
New to FX? Watch this Video. For live market updates, visit the Real Time News Feed
DailyFX provides forex news and technical analysis on the trends that influence the global currency markets.
Learn forex trading with a free practice account and trading charts from FXCM.
