Forex Analysis: US Dollar May Pull Back as S&P 500 Signals Rebound
THE TAKEAWAY: The US Dollar may correct lower on waning safe-haven demand as S&P 500 technical positioning hints a rebound may be in the cards ahead.
US DOLLAR TECHNICAL ANALYSIS– Prices edged through resistance at 10038, the 61.8% Fibonacci retracement, with buyers now aiming to challenge the 76.4% level at 10109. The first layer of significant support lines up at 10020, the top of a formerly broken rising channel set from mid-September, with a drop below that targeting the 50% retracement at 9982.
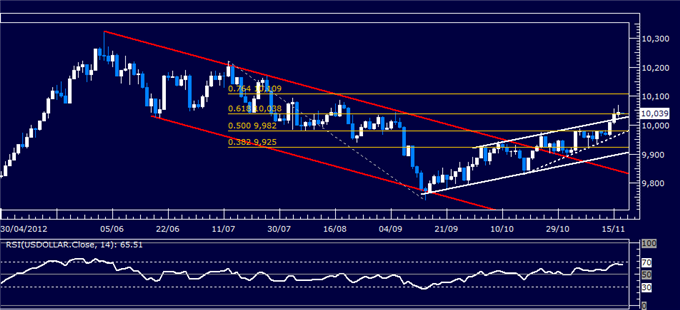
Daily Chart - Created Using FXCM Marketscope 2.0
S&P 500 TECHNICAL ANALYSIS – Prices put in a Bullish Engulfing candlestick pattern above support at 1344.50, the 61.8% Fibonacci retracement, hinting a bounce may be ahead. Initial resistance is at 1369.40, the 50% Fib, with a break above that exposing the 38.2% level at 1394.30. Alternatively, a reversal through support targets the 76.4% retracement at 1313.70.
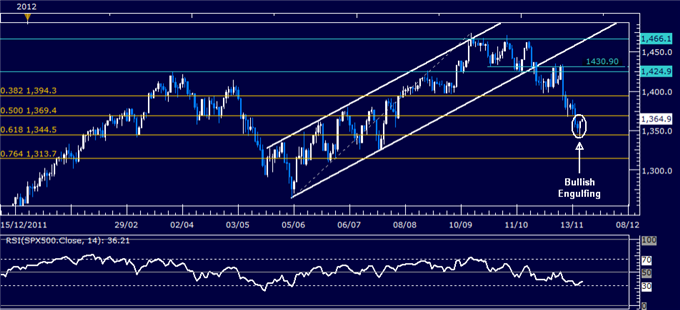
Daily Chart - Created Using FXCM Marketscope 2.0
GOLD TECHNICAL ANALYSIS – Prices are turning lower from resistance at 1732.33, the 23.6% Fibonacci retracement. Near-term support is at 1693.06, the 38.2% Fib, a barrier reinforced by a rising trend line set from late June (now at 1689.91). A drop beneath the latter level targets the 50% Fib at 1661.32. Alternatively, a push above resistance targets the 1790.55-1802.80 area
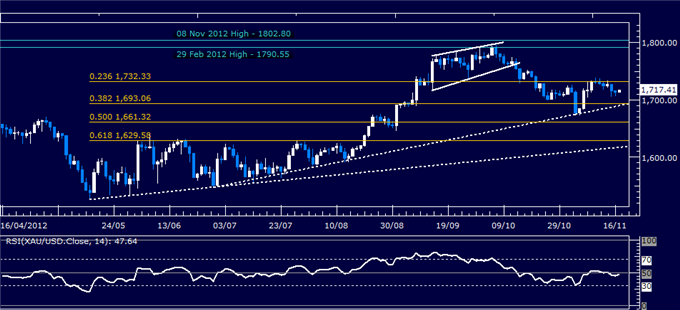
Daily Chart - Created Using FXCM Marketscope 2.0
Want to learn more about RSI? Watch this Video.
CRUDE OIL TECHNICAL ANALYSIS– Prices pushed above resistance at a falling trend line set from the September 14 high to challenge the 38.2% Fibonacci expansion at 87.70. A break above that exposes the 23.6% Fib at 92.53. Trend line resistance-turned-support is now at 86.36, with a push below that targeting the 50% expansion at 83.76.

Daily Chart - Created Using FXCM Marketscope 2.0
--- Written by Ilya Spivak, Currency Strategist for Dailyfx.com
To contact Ilya, e-mail ispivak@dailyfx.com. Follow Ilya on Twitter at @IlyaSpivak
To be added to Ilya's e-mail distribution list, please CLICK HERE
DailyFX provides forex news and technical analysis on the trends that influence the global currency markets.
Learn forex trading with a free practice account and trading charts from FXCM.
