Forex: USD/JPY Technical Analysis – Waiting for Triangle Break
To receive Ilya's analysis directly via email, please SIGN UP HERE
Talking Points:
USD/JPY Technical Strategy: Pending Long
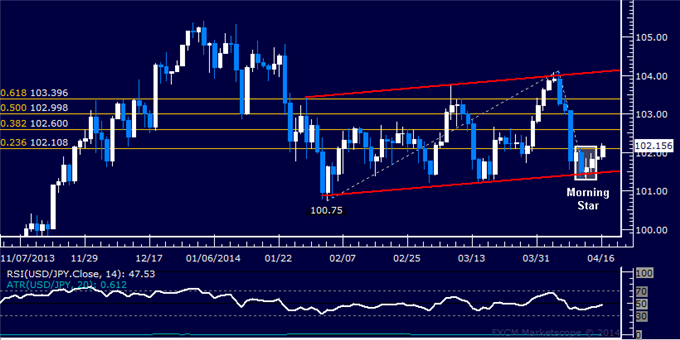
Support: 101.44 (Triangle floor)
Resistance:102.62-71 (Feb 11 close, Triangle top), 103.75-104.14 (Mar 7 high, 38.2% Fib exp.)
The US Dollar launched a recovery against the Japanese Yen as expected after prices produced a bullish Piercing Line candlestick pattern. On the whole, price action appears to be tracing out a Triangle chart pattern and hinting at upside trend continuation.A break above the 102.62-71 area, marked by a horizontal in play since mid-February and the Triangle top, exposes the March 7 high at 103.75. This is closely followed by the 38.2% Fibonacci expansion at 104.13. Triangle floor support is now at 101.44.
Confirmation of the Triangle pattern requires a daily close above the formation’s upper boundary. We will wait for that to materialize to look for a long trade opportunity.
Confirm your chart-based trade setups with the Technical Analyzer. New to FX? Start Here!
Daily Chart - Created Using FXCM Marketscope 2.0
--- Written by Ilya Spivak, Currency Strategist for DailyFX.com
DailyFX provides forex news and technical analysis on the trends that influence the global currency markets.
Learn forex trading with a free practice account and trading charts from FXCM.
