GBP/USD Technical Analysis – 3-Month Support Pressured
To receive Ilya's analysis directly via email, please SIGN UP HERE
Talking Points:
GBP/USD Technical Strategy: Flat
Support:1.6750 (trend line), 1.6711 (38.2% Fib ret.)
Resistance: 1.6820 (23.6% Fib ret.),1.6887 (14.6% Fib ret.),
The British Pound declined as expected after the release of the BOE Inflation Report, sinking to the lowest level in a month against the US Dollar. Prices are now set to test support at 1.6750, marked by a rising trend line set from early February. A break below this barrier on a daily closing basis exposes the 38.2% Fibonacci retracement at 1.6711. Near-term resistance is at 1.6820, marked by the 23.6% level. A reversal back above that aims for the 14.6% Fib at 1.6887.
Prices are too close to support to justify a short position from a risk/reward perspective. On the other hand, the absence of a defined bullish reversal signal warns against taking up the long side. With that in mind, we remain flat for now.
Confirm your chart-based trade setups with the Technical Analyzer. New to FX? Start Here!
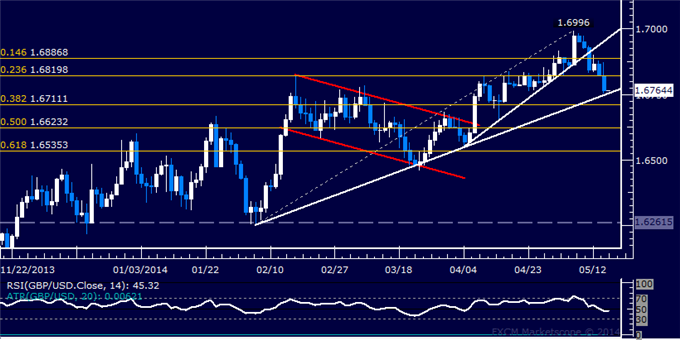
Daily Chart - Created Using FXCM Marketscope 2.0
--- Written by Ilya Spivak, Currency Strategist for DailyFX.com
DailyFX provides forex news and technical analysis on the trends that influence the global currency markets.
Learn forex trading with a free practice account and trading charts from FXCM.
