IMAX CORPORATION REPORTS RECORD Q3 2023 RESULTS
Global entertainment technology platform delivers strong Q3 year-over-year growth across all key financial metrics, including Revenue (+51%), Gross Margin (+98%) and Adjusted EBITDA (+174%)(1)
Network growth accelerates while system signings climb to 120 to-date — more than double what the Company delivered in all of 2022 (47)
Q3 marks the Company's second highest grossing quarter of all time at the global IMAX box office
Box office strength drives significant operating leverage, delivering in the third quarter $12 million in Net Income, Adjusted EPS(1) of $0.35, record Adjusted EBITDA(1) of $45 million and Adjusted EBITDA Margin(1) of 47%
Robust cash flow generation continues, with cash from operations of $55 million through nine months, compared with $0.5 million for the same period in 2022
NEW YORK, Oct. 25, 2023 /PRNewswire/ -- IMAX Corporation (NYSE: IMAX) today reported strong top and bottom-line financial results for the third quarter of 2023, demonstrating the value of its unique global entertainment technology platform and diversified content portfolio.
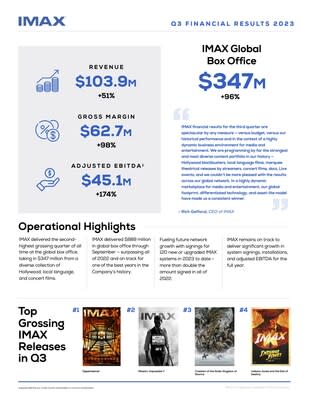
"IMAX financial results for the third quarter are spectacular by any measure — versus budget, versus our historical performance and in the context of a highly dynamic business environment for media and entertainment," said Richard L. Gelfond, Chief Executive Officer of IMAX. "We are programming by far the strongest and most diverse content portfolio in our history — Hollywood blockbusters, local language films, marquee theatrical releases by streamers, concert films, docs, Live events – and we couldn't be more pleased with the results across our global network."
"Our outsized performance with Hollywood blockbusters coupled with the expansion of our successful local language strategy is fueling strong network growth around the world, with robust sales activity in China and North America as well as key growth markets across Europe and Southeast Asia."
"It is clear that IMAX is the preferred way to experience blockbuster entertainment globally, and our global footprint, differentiated technology, and asset-lite model have made us a consistent winner. As we enter the fourth quarter, we remain on track to deliver significant growth in system signings, installations, and Adjusted EBITDA for the full year and one of the best years in our history at the global box office."
(1) | Non-GAAP Financial Measure. See the discussion at the end of this earnings release for a description of the non-GAAP financial measures used herein, as well as reconciliations to the most comparable GAAP amounts. | ||||
Third Quarter Financial Highlights | |||||||||||||||||||
Three Months Ended | Nine Months Ended | ||||||||||||||||||
September 30, | September 30, | ||||||||||||||||||
In millions of U.S. Dollars, except per share data | 2023 | 2022 | YoY % | 2023 | 2022 | YoY % | |||||||||||||
Total Revenue | $ | 103.9 | $ | 68.8 | 51 % | $ | 288.8 | $ | 202.8 | 42 % | |||||||||
Gross Margin | $ | 62.7 | $ | 31.7 | 98 % | $ | 170.7 | $ | 107.5 | 59 % | |||||||||
Gross Margin (%) | 60 % | 46 % | 59 % | 53 % | |||||||||||||||
Net Income (Loss)(2) | $ | 12.0 | $ | (9.0) | N/A | $ | 22.8 | $ | (25.4) | N/A | |||||||||
Diluted Net Income (Loss) per share(2) | $ | 0.22 | $ | (0.16) | N/A | $ | 0.41 | $ | (0.44) | N/A | |||||||||
Adjusted Net Income (Loss)(1)(2) | $ | 19.4 | $ | (3.0) | N/A | $ | 42.8 | $ | (7.3) | N/A | |||||||||
Adjusted Net Income (Loss) per share(1)(2) | $ | 0.35 | $ | (0.05) | N/A | $ | 0.77 | $ | (0.13) | N/A | |||||||||
Adjusted EBITDA per Credit Facility(1)(3) | $ | 45.1 | $ | 16.5 | 174 % | $ | 105.1 | $ | 56.7 | 85 % | |||||||||
Adjusted EBITDA Margin (%)(1)(2) | 47 % | 26 % | 81 % | 39 % | 30 % | 30 % | |||||||||||||
Weighted average shares outstanding (in millions): | |||||||||||||||||||
Basic | 54.6 | 56.0 | (3 %) | 54.4 | 57.3 | (5 %) | |||||||||||||
Diluted | 55.5 | 56.0 | (1 %) | 55.3 | 57.3 | (4 %) | |||||||||||||
(1) | Non-GAAP Financial Measure. See the discussion at the end of this earnings release for a description of the non-GAAP financial measures used herein, as well as reconciliations to the most comparable GAAP amounts. |
(2) | Attributable to common shareholders. |
(3) | Adjusted EBITDA per Credit facility attributable to common shareholders. |
Third Quarter and September YTD Segment Results(1) | |||||||||||||||||||||
Content Solutions | Technology Products and Services | ||||||||||||||||||||
In millions of U.S. Dollars | Revenue | Gross | Gross | Revenue | Gross | Gross | |||||||||||||||
3Q23 | $ | 44.2 | $ | 26.4 | 60 % | $ | 56.2 | $ | 33.8 | 60 % | |||||||||||
3Q22 | 22.0 | 9.1 | 42 % | 45.5 | 21.8 | 48 % | |||||||||||||||
% change | 101 % | 189 % | 23 % | 55 % | |||||||||||||||||
YTD 3Q23 | $ | 107.6 | $ | 64.4 | 60 % | $ | 171.8 | $ | 100.1 | 58 % | |||||||||||
YTD 3Q22 | 72.5 | 39.1 | 54 % | $ | 126.3 | 65.9 | 52 % | ||||||||||||||
% change | 48 % | 65 % | 36 % | 52 % | |||||||||||||||||
(1) | Please refer to the Company's Form 10-Q for the period ended September 30, 2023, for additional segment information. | |||||
Content Solutions Segment
Content Solutions revenues of $44.2 million increased 101% year-over-year. Gross box office from IMAX locations in Q3 2023 of $347.1 million was up 96% from Q3 2022. Key contributors to third quarter box office performance included:
Hollywood titles led by Oppenheimer with $180 million in IMAX GBO with significant contributions coming from Mission Impossible: Dead Reckoning Part 1 and Indiana Jones and the Dial of Destiny.
Local language titles led by the record setting Chinese title Creation of the Gods: Kingdom of Storms ($32.3 million in IMAX GBO), with strong contributions coming from No More Bets, Lost in the Stars, and Jawan.
Gross margin for Content Solutions was $26.4 million (at a 60% margin) and increased 189% compared to the third quarter of the prior year period. This outsized growth was driven by the operating leverage in our business that resulted in very pronounced profit flow-through from box office.
Technology Products and Services Segment
Technology Products and Services revenues and gross margin increased 23% year-over-year to $56.2 million and 55% year-over-year to $33.8 million, respectively, which reflects growth in box office tied to rental revenues as well as a higher number of sale/hybrid installations.
During the third quarter the Company installed 30 systems compared to 17 systems in the third quarter of 2022. Of those, 16 systems were under sales and hybrid JRSA arrangements, compared to 9 systems in the prior year.
Operating Cash Flow and Liquidity
Net cash provided by operating activities for the nine months through September was $54.6 million compared to net cash provided by operating activities of $0.5 million in the prior year period.
As of September 30, 2023, the Company's available liquidity was $308.9 million or $438.9 million excluding the letter of credit associated with the IMAX China privatization transaction. Our liquidity includes cash and cash equivalents of $109.6 million, $150.0 million in available borrowing capacity under the Credit Facility, $130.0 million for the standby letter of credit and $49.2 million in available borrowing capacity under IMAX China's revolving facilities. Total debt, excluding deferred financing costs, was $258.2 million as of September 30, 2023.
In 2021, the Company issued $230.0 million of 0.500% Convertible Senior Notes due 2026 ("Convertible Notes"). In connection with the pricing of the Convertible Notes, the Company entered into privately negotiated capped call transactions with an initial cap price of $37.2750 per share of the Company's common shares.
Share Count and Capital Return
The weighted average basic and diluted shares outstanding in the third quarter of 2023 were 54.6 million and 55.5 million, respectively, compared to 56.0 million for both in the third quarter of 2022, a decrease of 3% and 1%, respectively.
The Company repurchased 362,784 common shares at an average price of $16.90 per share, for a total of $6.1 million, excluding commission, year-to-date through October 24, 2023.
On June 14, 2023, the Company announced a 3-year extension to its share-repurchase program through June 30, 2026. The current share-repurchase program authorizes the Company to repurchase up to $400 million of its common shares, of which approximately $187.3 million remains available.
Supplemental Materials
For more information about the Company's results, please refer to the IMAX Investor Relations website located at investors.imax.com.
Investor Relations Website and Social Media
On a weekly basis, the Company posts quarter-to-date box office results on the IMAX Investor Relations website located at investors.imax.com. The Company expects to provide such updates on Tuesday of each week, although the Company may change this timing without notice. Results will be displayed with a few days lag.
The Company may post additional information on the Company's corporate and Investor Relations website which may be material to investors. Accordingly, investors, media and others interested in the Company should monitor the Company's website in addition to the Company's press releases, SEC filings and public conference calls and webcasts, for additional information about the Company.
Conference Call
The Company will host a conference call today at 8:30 AM ET to discuss its third quarter 2023 financial results. This call is being webcast and can be accessed at investors.imax.com. To access the call via telephone, interested parties please pre-register here: https://register.vevent.com/register/BI507a09f12d7e4417a07562a7285253bd and you will be provided with a dial-in number and unique pin. To avoid delays, we encourage participants to dial into the conference call ten minutes ahead of the scheduled start time. A replay of the call will be available via webcast at investors.imax.com.
About IMAX Corporation
IMAX, an innovator in entertainment technology, combines proprietary software, architecture, and equipment to create experiences that take you beyond the edge of your seat to a world you've never imagined. Top filmmakers and studios are utilizing IMAX systems to connect with audiences in extraordinary ways, and, as such, IMAX's network is among the most important and successful theatrical distribution platforms for major event films around the globe. Streaming technology company SSIMWAVE, an IMAX subsidiary, is a leader in AI-driven video quality solutions for media and entertainment companies.
IMAX is headquartered in New York, Toronto, and Los Angeles, with additional offices in London, Dublin, Tokyo, and Shanghai. As of September 30, 2023, there were 1,731 IMAX systems (1,651 commercial multiplexes, 12 commercial destinations, 68 institutional) operating in 87 countries and territories. Shares of IMAX China Holding, Inc., a subsidiary of IMAX Corporation, trade on the Hong Kong Stock Exchange under the stock code "1970."
IMAX®, IMAX® 3D, Experience It In IMAX®, The IMAX Experience®, DMR®, Filmed For IMAXTM, IMAX LiveTM, IMAX Enhanced®, and SSIMWAVE® are trademarks and trade names of the Company or its subsidiaries that are registered or otherwise protected under laws of various jurisdictions. More information about the Company can be found at www.imax.com. You may also connect with IMAX on Instagram (https://www.instagram.com/imax), Facebook (www.facebook.com/imax), Twitter (www.twitter.com/imax) and YouTube (www.youtube.com/imaxmovies).
For additional information please contact:
Investors: | Media: |
Forward-Looking Statements
This earnings release contains forward looking statements that are based on IMAX management's assumptions and existing information and involve certain risks and uncertainties which could cause actual results to differ materially from future results expressed or implied by such forward looking statements. These forward-looking statements include, but are not limited to, business and technology strategies and measures to implement strategies, competitive strengths, goals, expansion and growth of business, operations and technology, future capital expenditures (including the amount and nature thereof), industry prospects and consumer behavior, statements regarding the emergence of Cineworld from bankruptcy, as well as plans and references to the future success of IMAX Corporation together with its consolidated subsidiaries (the "Company") and expectations regarding the Company's future operating, financial and technological results. These forward-looking statements are based on certain assumptions and analyses made by the Company in light of its experience and its perception of historical trends, current conditions and expected future developments, as well as other factors it believes are appropriate in the circumstances. However, whether actual results and developments will conform with the expectations and predictions of the Company is subject to a number of risks and uncertainties, including, but not limited to, risks related to the adverse impact of the COVID-19 pandemic; risks associated with investments and operations in foreign jurisdictions and any future international expansion, including those related to economic, political and regulatory policies of local governments and laws and policies of the United States and Canada, as well as geopolitical conflicts; risks related to the Company's growth and operations in China; the performance of IMAX DMR® films and other films released to the IMAX network; the signing of IMAX System agreements; conditions, changes and developments in the commercial exhibition industry; risks related to currency fluctuations; the potential impact of increased competition in the markets within which the Company operates, including competitive actions by other companies; the failure to respond to change and advancements in digital technology; risks relating to consolidation among commercial exhibitors and studios; risks related to brand extensions and new business initiatives; conditions in the in-home and out-of-home entertainment industries; the opportunities (or lack thereof) that may be presented to and pursued by the Company; risks related to cyber-security and data privacy; risks related to the Company's inability to protect the Company's intellectual property; risks related to climate change; risks related to weather conditions and natural disasters that may disrupt or harm the Company's business; risks related to the Company's indebtedness and compliance with its debt agreements; general economic, market or business conditions; risks related to political, economic and social instability; the failure to convert system backlog into revenue; changes in laws or regulations; any statements of belief and any statements of assumptions underlying any of the foregoing; other factors and risks outlined in the Company's periodic filings with the SEC; and other factors, many of which are beyond the control of the Company. Consequently, all of the forward-looking statements made in this earnings release are qualified by these cautionary statements, and actual results or anticipated developments by the Company may not be realized, and even if substantially realized, may not have the expected consequences to, or effects on, the Company. These factors, other risks and uncertainties and financial details are discussed in the Company's most recent Annual Report on Form 10-K, as supplemented by those discussed in the Company's Quarterly Report on Form 10-Q. The Company undertakes no obligation to update publicly or otherwise revise any forward-looking statements, whether as a result of new information, future events or otherwise.
Primary Reporting Groups
The Company's Chief Executive Officer ("CEO") is its Chief Operating Decision Maker ("CODM"), as such term is defined under U.S. GAAP. The CODM assesses segment performance based on segment revenues and segment gross margins. Selling, general and administrative expenses, research and development costs, the amortization of intangible assets, provision for (reversal of) current expected credit losses, certain write-downs, interest income, interest expense, and income tax (expense) benefit are not allocated to the Company's segments.
In the first quarter of 2023, the Company revised its internal segment reporting, including the information provided to the CODM to assess segment performance and allocate resources. Accordingly, the Company has two reportable segments: (i) Content Solutions, which principally includes content enhancement and distribution services, previously included within the IMAX DMR, Film Distribution and Film Post-Production segments, and (ii) Technology Products and Services, which principally includes the sale, lease, and maintenance of IMAX Systems, previously included within the JRSA, IMAX Systems, IMAX Maintenance, and Other Theater Business segments. The Company's activities that do not meet the criteria to be considered a reportable segment are reported within All Other. Prior period comparatives have been revised to conform with the current period presentation.
The Company has the following reportable segments:
(i) | Content Solutions, which principally includes the digital remastering of films and other content into IMAX formats for distribution to the IMAX network. To a lesser extent, the Content Solutions segment also earns revenue from the distribution of large-format documentary films and exclusive experiences ranging from live performances to interactive events with leading artists and creators, as well as film post-production services. |
(ii) | Technology Products and Services, which includes results from the sale or lease of IMAX Systems, as well as from the maintenance of IMAX Systems. To a lesser extent, the Technology Product and Services segment also earns revenue from certain ancillary theater business activities, including after-market sales of IMAX System parts and 3D glasses. |
Transactions between segments are valued at exchange value. Inter-segment profits are eliminated upon consolidation, as well as for the disclosures below.
IMAX Network and Backlog | |||||||||||||||||
Three Months Ended | Nine Months Ended | ||||||||||||||||
System Signings: | 2023 | 2022 | 2023 | 2022 | |||||||||||||
New IMAX Systems | |||||||||||||||||
Sales and sales-type lease arrangements | 7 | 3 | 44 | 9 | |||||||||||||
Hybrid JRSA | — | 1 | — | 3 | |||||||||||||
Traditional JRSA | 7 | 7 | 32 | 9 | |||||||||||||
Total new IMAX Systems | 14 | 11 | 76 | 21 | |||||||||||||
Upgrades of IMAX systems | 6 | 4 | 18 | 14 | |||||||||||||
Total IMAX System signings | 20 | 15 | 94 | 35 | |||||||||||||
Three Months Ended | Nine Months Ended | ||||||||||||||||
System Installations: | 2023 | 2022 | 2023 | 2022 | |||||||||||||
New IMAX Systems | |||||||||||||||||
Sales and sales-type lease arrangements | 14 | 7 | 30 | 14 | |||||||||||||
Hybrid JRSA | — | 2 | 2 | 5 | |||||||||||||
Traditional JRSA | 4 | 7 | 7 | 16 | |||||||||||||
Total new IMAX Systems | 18 | 16 | 39 | 35 | |||||||||||||
Upgrades of IMAX Systems | 12 | 1 | 20 | 5 | |||||||||||||
Total IMAX System installations | 30 | 17 | 59 | 40 | |||||||||||||
September 30, | |||||||||||||||||
IMAX System Backlog: | 2023 | 2022 | |||||||||||||||
Sales and sales-type lease arrangements | 192 | 170 | |||||||||||||||
Hybrid JRSA | 107 | 127 | |||||||||||||||
Traditional JRSA | 187 | 192 | |||||||||||||||
Total IMAX System backlog | 486 | 489 | |||||||||||||||
September 30, | |||||||||||||||||
IMAX Network: | 2023 | 2022 | |||||||||||||||
Commercial Multiplex Theaters | |||||||||||||||||
Sales and sales-type lease arrangements | 743 | 696 | |||||||||||||||
Hybrid JRSA | 137 | 150 | |||||||||||||||
Traditional JRSA | 771 | 776 | |||||||||||||||
Total Commercial Multiplex Theaters | 1,651 | 1,622 | |||||||||||||||
Commercial Destination Theaters | 12 | 12 | |||||||||||||||
Institutional Theaters | 68 | 69 | |||||||||||||||
Total IMAX network | 1,731 | 1,703 | |||||||||||||||
IMAX CORPORATION | |||||||||||||||||
CONDENSED CONSOLIDATED STATEMENTS OF OPERATIONS | |||||||||||||||||
(In thousands of U.S. dollars, except per share amounts) | |||||||||||||||||
(Unaudited) | |||||||||||||||||
Three Months Ended | Nine Months Ended | ||||||||||||||||
September 30, | September 30, | ||||||||||||||||
2023 | 2022 | 2023 | 2022 | ||||||||||||||
Revenues | |||||||||||||||||
Technology sales | $ | 18,273 | $ | 18,065 | $ | 65,455 | $ | 35,270 | |||||||||
Image enhancement and maintenance services | 60,250 | 36,233 | 154,244 | 117,285 | |||||||||||||
Technology rentals | 23,008 | 12,540 | 62,612 | 43,726 | |||||||||||||
Finance income | 2,365 | 1,917 | 6,510 | 6,478 | |||||||||||||
103,896 | 68,755 | 288,821 | 202,759 | ||||||||||||||
Costs and expenses applicable to revenues | |||||||||||||||||
Technology sales | 7,948 | 10,061 | 28,951 | 20,264 | |||||||||||||
Image enhancement and maintenance services | 26,646 | 20,563 | 69,470 | 56,259 | |||||||||||||
Technology rentals | 6,587 | 6,430 | 19,747 | 18,728 | |||||||||||||
41,181 | 37,054 | 118,168 | 95,251 | ||||||||||||||
Gross margin | 62,715 | 31,701 | 170,653 | 107,508 | |||||||||||||
Selling, general and administrative expenses | 36,282 | 32,905 | 109,336 | 100,181 | |||||||||||||
Research and development | 2,771 | 1,115 | 7,388 | 3,667 | |||||||||||||
Amortization of intangible assets | 1,107 | 1,111 | 3,328 | 3,412 | |||||||||||||
Credit loss expense, net | 523 | 808 | 1,589 | 8,149 | |||||||||||||
Asset impairments | — | — | — | 4,470 | |||||||||||||
Executive transition costs | — | — | 1,353 | — | |||||||||||||
Income (loss) from operations | 22,032 | (4,238) | 47,659 | (12,371) | |||||||||||||
Unrealized investment gains | 364 | 35 | 436 | 99 | |||||||||||||
Retirement benefits non-service expense | (77) | (140) | (232) | (417) | |||||||||||||
Interest income | 738 | 257 | 1,838 | 1,176 | |||||||||||||
Interest expense | (1,483) | (1,323) | (5,045) | (4,354) | |||||||||||||
Income (loss) before taxes | 21,574 | (5,409) | 44,656 | (15,867) | |||||||||||||
Income tax expense | (6,555) | (2,348) | (14,901) | (8,091) | |||||||||||||
Net income (loss) | 15,019 | (7,757) | 29,755 | (23,958) | |||||||||||||
Less: net (income) loss attributable to non-controlling interests | (3,029) | (1,196) | (6,960) | (1,455) | |||||||||||||
Net income (loss) attributable to common shareholders | $ | 11,990 | $ | (8,953) | $ | 22,795 | $ | (25,413) | |||||||||
Net income (loss) per share attributable to common shareholders: | |||||||||||||||||
Basic | $ | 0.22 | $ | (0.16) | $ | 0.42 | $ | (0.44) | |||||||||
Diluted | $ | 0.22 | $ | (0.16) | $ | 0.41 | $ | (0.44) | |||||||||
Weighted average shares outstanding (in thousands): | |||||||||||||||||
Basic | 54,618 | 56,039 | 54,424 | 57,301 | |||||||||||||
Diluted | 55,535 | 56,039 | 55,261 | 57,301 | |||||||||||||
Additional Disclosure: | |||||||||||||||||
Depreciation and amortization | $ | 19,279 | $ | 15,640 | $ | 46,477 | $ | 42,663 | |||||||||
Amortization of deferred financing costs | $ | 492 | $ | 712 | $ | 1,742 | $ | 2,465 | |||||||||
IMAX CORPORATION | ||||||||
CONDENSED CONSOLIDATED BALANCE SHEETS | ||||||||
(In thousands of U.S. dollars, except share amounts) | ||||||||
(Unaudited) | ||||||||
September 30, | December 31, | |||||||
2023 | 2022 | |||||||
Assets | ||||||||
Cash and cash equivalents | $ | 109,603 | $ | 97,401 | ||||
Accounts receivable, net of allowance for credit losses | 135,962 | 136,142 | ||||||
Financing receivables, net of allowance for credit losses | 125,322 | 129,384 | ||||||
Variable consideration receivables, net of allowance for credit losses | 59,042 | 44,024 | ||||||
Inventories | 45,365 | 31,534 | ||||||
Prepaid expenses | 13,042 | 12,343 | ||||||
Film assets, net of accumulated amortization | 5,232 | 5,277 | ||||||
Property, plant and equipment, net of accumulated depreciation | 238,140 | 252,896 | ||||||
Investment in equity securities | — | 1,035 | ||||||
Other assets | 20,119 | 15,665 | ||||||
Deferred income tax assets, net of valuation allowance | 11,961 | 9,900 | ||||||
Goodwill | 52,815 | 52,815 | ||||||
Other intangible assets, net of accumulated amortization | 34,343 | 32,738 | ||||||
Total assets | $ | 850,946 | $ | 821,154 | ||||
Liabilities | ||||||||
Accounts payable | $ | 37,699 | $ | 25,237 | ||||
Accrued and other liabilities | 123,863 | 117,286 | ||||||
Deferred revenue | 66,272 | 70,940 | ||||||
Revolving credit facility borrowings, net of unamortized debt issuance costs | 23,903 | 36,111 | ||||||
Convertible notes and other borrowings, net of unamortized discounts and debt issuance costs | 228,449 | 226,912 | ||||||
Deferred income tax liabilities | 13,349 | 14,900 | ||||||
Total liabilities | 493,535 | 491,386 | ||||||
Commitments, contingencies and guarantees | ||||||||
Non-controlling interests | 661 | 722 | ||||||
Shareholders' equity | ||||||||
Capital stock common shares — no par value. Authorized — unlimited number. | ||||||||
54,607,095 issued and outstanding (December 31, 2022 — 54,148,614 issued and | 390,097 | 376,715 | ||||||
Other equity | 179,970 | 185,678 | ||||||
Statutory surplus reserve | 3,932 | 3,932 | ||||||
Accumulated deficit | (272,318) | (293,124) | ||||||
Accumulated other comprehensive loss | (14,637) | (9,846) | ||||||
Total shareholders' equity attributable to common shareholders | 287,044 | 263,355 | ||||||
Non-controlling interests | 69,706 | 65,691 | ||||||
Total shareholders' equity | 356,750 | 329,046 | ||||||
Total liabilities and shareholders' equity | $ | 850,946 | $ | 821,154 | ||||
IMAX CORPORATION | ||||||||
CONDENSED CONSOLIDATED STATEMENTS OF CASH FLOWS | ||||||||
(In thousands of U.S. dollars) | ||||||||
(Unaudited) | ||||||||
Nine Months Ended | ||||||||
September 30, | ||||||||
2023 | 2022 | |||||||
Operating Activities | ||||||||
Net income (loss) | $ | 29,755 | $ | (23,958) | ||||
Adjustments to reconcile net income (loss) to cash provided by operating activities: | ||||||||
Depreciation and amortization | 46,477 | 42,663 | ||||||
Amortization of deferred financing costs | 1,742 | 2,465 | ||||||
Credit loss expense, net | 1,589 | 8,149 | ||||||
Write-downs | 872 | 5,707 | ||||||
Deferred income tax benefit | (3,724) | (3,374) | ||||||
Share-based and other non-cash compensation | 17,830 | 19,510 | ||||||
Unrealized foreign currency exchange loss | 52 | 1,310 | ||||||
Unrealized investment gains | (436) | (99) | ||||||
Changes in assets and liabilities: | ||||||||
Accounts receivable | (2,392) | (18,050) | ||||||
Inventories | (13,771) | (10,131) | ||||||
Film assets | (14,575) | (14,174) | ||||||
Deferred revenue | (4,670) | (5,989) | ||||||
Changes in other operating assets and liabilities | (4,141) | (3,548) | ||||||
Net cash provided by operating activities | 54,608 | 481 | ||||||
Investing Activities | ||||||||
Purchase of property, plant and equipment | (2,541) | (5,248) | ||||||
Investment in equipment for joint revenue sharing arrangements | (10,705) | (14,543) | ||||||
Interest in film classified as a financial instrument | — | (4,731) | ||||||
Acquisition of other intangible assets | (5,418) | (3,246) | ||||||
Acquisition of SSIMWAVE, net of cash and cash equivalents acquired | — | (12,639) | ||||||
Net cash used in investing activities | (18,664) | (40,407) | ||||||
Financing Activities | ||||||||
Revolving credit facility borrowings | 31,032 | 4,890 | ||||||
Repayments of revolving credit facility borrowings | (43,057) | (3,600) | ||||||
Credit facility amendment fees paid | — | (2,277) | ||||||
Other borrowings | 315 | — | ||||||
Repurchase of common shares | (4,263) | (53,581) | ||||||
Repurchase of common shares, IMAX China | — | (3,043) | ||||||
Taxes withheld and paid on employee stock awards vested | (6,458) | (3,393) | ||||||
Principal payment under finance lease obligations | (480) | (890) | ||||||
Dividends paid to non-controlling interests | (1,438) | (2,701) | ||||||
Net cash used in financing activities | (24,349) | (64,595) | ||||||
Effects of exchange rate changes on cash | 607 | 1,961 | ||||||
Increase (decrease) in cash and cash equivalents during period | 12,202 | (102,560) | ||||||
Cash and cash equivalents, beginning of period | 97,401 | 189,711 | ||||||
Cash and cash equivalents, end of period | $ | 109,603 | $ | 87,151 | ||||
Segment Revenue and Gross Margin | |||||||||||||||||
Three Months Ended | Nine Months Ended | ||||||||||||||||
September 30, | September 30, | ||||||||||||||||
(In thousands of U.S. Dollars) | 2023 | 2022 | 2023 | 2022 | |||||||||||||
Revenue | |||||||||||||||||
Content Solutions | $ | 44,214 | $ | 21,967 | $ | 107,605 | $ | 72,499 | |||||||||
Technology Products and Services | 56,169 | 45,542 | 171,813 | 126,262 | |||||||||||||
Sub-total for reportable segments | 100,383 | 67,509 | 279,418 | 198,761 | |||||||||||||
All Other(1) | 3,513 | 1,246 | 9,403 | 3,998 | |||||||||||||
Total | $ | 103,896 | $ | 68,755 | $ | 288,821 | $ | 202,759 | |||||||||
Gross Margin | |||||||||||||||||
Content Solutions | $ | 26,407 | $ | 9,140 | $ | 64,397 | $ | 39,121 | |||||||||
Technology Products and Services | 33,761 | 21,752 | 100,066 | 65,875 | |||||||||||||
Sub-total for reportable segments | 60,168 | 30,892 | 164,463 | 104,996 | |||||||||||||
All Other(1) | 2,547 | 809 | 6,190 | 2,512 | |||||||||||||
Total | $ | 62,715 | $ | 31,701 | $ | 170,653 | $ | 107,508 | |||||||||
(1) | All Other includes the results from the Company's streaming and consumer technology business, as well as other ancillary activities. | |||||
IMAX CORPORATION
NON-GAAP FINANCIAL MEASURES
(in thousands of U.S. dollars)
In this release, the Company presents adjusted net income (loss) attributable to common shareholders and adjusted net income (loss) attributable to common shareholders per basic and diluted share, EBITDA, Adjusted EBITDA per Credit Facility, Adjusted EBITDA margin as supplemental measures of the Company's performance, which are not recognized under U.S. GAAP. Adjusted net income (loss) attributable to common shareholders and adjusted net income (loss) attributable to common shareholders per basic and diluted share exclude, where applicable: (i) share-based compensation; (ii) COVID-19 government relief benefits, net, (iii) realized and unrealized investment gains or losses; (iv) transaction-related expenses, and (v) executive transition costs, as well as the related tax impact of these adjustments.
The Company believes that these non-GAAP financial measures are important supplemental measures that allow management and users of the Company's financial statements to view operating trends and analyze controllable operating performance on a comparable basis between periods without the after-tax impact of share-based compensation and certain unusual items included in net income (loss) attributable to common shareholders. Although share-based compensation is an important aspect of the Company's employee and executive compensation packages, it is a non-cash expense and is excluded from certain internal business performance measures.
A reconciliation from net income (loss) attributable to common shareholders and the associated per share amounts to adjusted net income (loss) attributable to common shareholders and adjusted net income (loss) attributable to common shareholders per basic and diluted share are presented in the table below. Net income (loss) attributable to common shareholders and the associated per share amounts are the most directly comparable GAAP measures because they reflect the earnings relevant to the Company's shareholders, rather than the earnings attributable to non-controlling interests.
In addition to the non-GAAP financial measures discussed above, management also uses "EBITDA," as well as "Adjusted EBITDA per Credit Facility," as defined in the Company's Credit Agreement. As allowed by the Credit Agreement, Adjusted EBITDA per Credit Facility includes adjustments in addition to the exclusion of interest, taxes, depreciation and amortization. Accordingly, this non-GAAP financial measure is presented to allow a more comprehensive analysis of the Company's operating performance and to provide additional information with respect to the Company's compliance against its Credit Agreement requirements, when applicable. In addition, the Company believes that Adjusted EBITDA per Credit Facility presents relevant and useful information widely used by analysts, investors and other interested parties in the Company's industry to evaluate, assess and benchmark the Company's results.
EBITDA is defined as net income or loss excluding (i) income tax expense or benefit; (ii) interest expense, net of interest income; (iii) depreciation and amortization, including film asset amortization; and (iv) amortization of deferred financing costs. Adjusted EBITDA per Credit Facility is defined as EBITDA excluding: (i) share-based and other non-cash compensation; (ii) realized and unrealized investment gains or losses; (iii) transaction-related expenses; (iv) executive transition costs; and (v) write-downs, net of recoveries, including asset impairments and credit loss expense.
A reconciliation of net income (loss) attributable to common shareholders, which is the most directly comparable GAAP measure, to EBITDA and Adjusted EBITDA per Credit Facility is presented in the table below. Net income (loss) attributable to common shareholders is the most directly comparable GAAP measure because it reflects the earnings relevant to the Company's shareholders, rather than the earnings attributable to non-controlling interests.
In this release, the Company also presents free cash flow, which is not recognized under U.S. GAAP, as a supplemental measure of the Company's liquidity. The Company's definition of free cash flow deducts only normal recurring capital expenditures, including its investment in joint revenue sharing arrangements, the purchase of property, plant and equipment and the acquisition of other intangible assets (from the Consolidated Statements of Cash Flows), from net cash provided by or used in operating activities. Management believes that free cash flow is a supplemental measure of the cash flow available to reduce debt, add to cash balances, and fund other financing activities. Free cash flow does not represent residual cash flow available for discretionary expenditures. A reconciliation of cash provided by operating activities to free cash flow is presented below.
These non-GAAP measures may not be comparable to similarly titled amounts reported by other companies. Additionally, the non-GAAP financial measures used by the Company should not be considered as a substitute for, or superior to, the comparable GAAP amounts.
Adjusted EBITDA per Credit Facility | ||||||||||||||||||||||||
For the Three Months Ended September 30, | For the Three Months Ended September 30, | |||||||||||||||||||||||
Attributable to | Attributable to | |||||||||||||||||||||||
Non-controlling | Less: | Non-controlling | Less: | |||||||||||||||||||||
Interests and | Attributable to | Attributable to | Interests and | Attributable to | Attributable to | |||||||||||||||||||
Common | Non-controlling | Common | Common | Non-controlling | Common | |||||||||||||||||||
(In thousands of U.S. Dollars) | Shareholders | Interests | Shareholders | Shareholders | Interests | Shareholders | ||||||||||||||||||
Reported net income (loss) | $ | 15,019 | $ | 3,029 | $ | 11,990 | $ | (7,757) | $ | 1,196 | $ | (8,953) | ||||||||||||
Add (subtract): | ||||||||||||||||||||||||
Income tax expense | 6,555 | 1,041 | 5,514 | 2,348 | (22) | 2,370 | ||||||||||||||||||
Interest expense, net of interest income | 253 | (145) | 398 | 354 | (39) | 393 | ||||||||||||||||||
Depreciation and amortization, including film asset | 19,279 | 1,304 | 17,975 | 15,640 | 1,214 | 14,426 | ||||||||||||||||||
Amortization of deferred financing costs(1) | 492 | — | 492 | 712 | — | 712 | ||||||||||||||||||
EBITDA | $ | 41,598 | $ | 5,229 | $ | 36,369 | $ | 11,297 | $ | 2,349 | $ | 8,948 | ||||||||||||
Share-based and other non-cash compensation | 5,297 | 155 | 5,142 | 5,544 | (27) | 5,571 | ||||||||||||||||||
Unrealized investment gains | (364) | (93) | (271) | (35) | — | (35) | ||||||||||||||||||
Transaction-related expenses | 3,086 | — | 3,086 | 955 | — | 955 | ||||||||||||||||||
Write-downs, including asset impairments and credit | 921 | 164 | 757 | 1,083 | 66 | 1,017 | ||||||||||||||||||
Adjusted EBITDA per Credit Facility | $ | 50,538 | $ | 5,455 | $ | 45,083 | $ | 18,844 | $ | 2,388 | $ | 16,456 | ||||||||||||
Revenues attributable to common shareholders(2) | $ | 103,896 | $ | 8,028 | $ | 95,868 | $ | 68,755 | $ | 4,257 | $ | 64,498 | ||||||||||||
Adjusted EBITDA margin attributable to common | 49 % | 68 % | 47 % | 27 % | 56 % | 26 % | ||||||||||||||||||
For the Twelve Months Ended September 30, | For the Twelve Months Ended September 30, | |||||||||||||||||||||||
Attributable to | Attributable to | |||||||||||||||||||||||
Non-controlling | Less: | Non-controlling | Less: | |||||||||||||||||||||
Interests and | Attributable to | Attributable to | Interests and | Attributable to | Attributable to | |||||||||||||||||||
Common | Non-controlling | Common | Common | Non-controlling | Common | |||||||||||||||||||
(In thousands of U.S. Dollars) | Shareholders | Interests | Shareholders | Shareholders | Interests | Shareholders | ||||||||||||||||||
Reported net income (loss) | $ | 33,836 | $ | 8,428 | $ | 25,408 | $ | (10,579) | $ | 4,734 | $ | (15,313) | ||||||||||||
Add (subtract): | ||||||||||||||||||||||||
Income tax expense | 16,917 | 2,658 | 14,259 | 19,239 | 2,027 | 17,212 | ||||||||||||||||||
Interest expense, net of interest income | 2,024 | (286) | 2,310 | 970 | (327) | 1,297 | ||||||||||||||||||
Depreciation and amortization, including film asset | 60,475 | 5,260 | 55,215 | 58,175 | 5,056 | 53,119 | ||||||||||||||||||
Amortization of deferred financing costs(1) | 2,454 | — | 2,454 | 3,229 | — | 3,229 | ||||||||||||||||||
EBITDA | $ | 115,706 | $ | 16,060 | $ | 99,646 | $ | 71,034 | $ | 11,490 | $ | 59,544 | ||||||||||||
Share-based and other non-cash compensation | 25,893 | 835 | 25,058 | 27,031 | 845 | 26,186 | ||||||||||||||||||
Unrealized investment gains | (407) | (93) | (314) | (128) | — | (128) | ||||||||||||||||||
Transaction-related expenses | 3,408 | — | 3,408 | 955 | — | 955 | ||||||||||||||||||
Write-downs, including asset impairments and credit | 4,328 | 561 | 3,767 | 15,675 | 1,538 | 14,137 | ||||||||||||||||||
Executive transition costs | 1,353 | — | 1,353 | — | — | — | ||||||||||||||||||
Adjusted EBITDA per Credit Facility | $ | 150,281 | $ | 17,363 | $ | 132,918 | $ | 114,567 | $ | 13,873 | $ | 100,694 | ||||||||||||
Revenues attributable to common shareholders(2) | $ | 386,867 | $ | 28,260 | $ | 358,607 | $ | 311,331 | $ | 24,347 | $ | 286,984 | ||||||||||||
Adjusted EBITDA margin attributable to common | 39 % | 61 % | 37 % | 37 % | 57 % | 35 % | ||||||||||||||||||
(1) | The amortization of deferred financing costs is recorded within Interest Expense in the Condensed Consolidated Statement of Operations. | |||||
(2) | Revenues attributable to common shareholders calculated as follows: | |||||
Three months ended | Three months ended | Twelve months ended | Twelve months ended | |||||||||||||||||||||||||||||||||||
(In thousands of U.S. Dollars) | September 30, 2023 | September 30, 2022 | September 30, 2023 | September 30, 2022 | ||||||||||||||||||||||||||||||||||
Total revenues | $ | 103,896 | $ | 68,755 | $ | 386,867 | $ | 311,331 | ||||||||||||||||||||||||||||||
Greater China revenues | $ | 28,297 | $ | 14,889 | $ | 99,703 | $ | 84,769 | ||||||||||||||||||||||||||||||
Non-controlling interest ownership percentage(3) | 28.37 % | 28.59 % | 28.34 % | 28.72 % | ||||||||||||||||||||||||||||||||||
Deduction for non-controlling interest share of | (8,028) | (4,257) | (28,260) | (24,347) | ||||||||||||||||||||||||||||||||||
Revenues attributable to common shareholders | $ | 95,868 | $ | 64,498 | $ | 358,607 | $ | 286,984 | ||||||||||||||||||||||||||||||
(3) | Weighted average ownership percentage for change in non-controlling interest share. |
Adjusted Net Income (Loss) Attributable to Common Shareholders and Adjusted Net Income (Loss) Per Share | ||||||||||||||||
Three Months Ended September 30, | ||||||||||||||||
2023 | 2022 | |||||||||||||||
(In thousands of U.S. Dollars, except per share amounts) | Net Income | Per Share | Net Loss | Per Share | ||||||||||||
Net income (loss) attributable to common shareholders | $ | 11,990 | $ | 0.22 | $ | (8,953) | $ | (0.16) | ||||||||
Adjustments(1): | ||||||||||||||||
Share-based compensation | 5,063 | 0.09 | 5,431 | 0.10 | ||||||||||||
COVID-19 government relief benefits, net | — | — | (212) | — | ||||||||||||
Unrealized investment gains | (454) | (0.01) | (34) | — | ||||||||||||
Transaction-related expenses | 3,086 | 0.06 | 955 | 0.02 | ||||||||||||
Tax impact on items listed above | (275) | — | (214) | — | ||||||||||||
Adjusted net income (loss)(1) | $ | 19,410 | $ | 0.35 | $ | (3,027) | $ | (0.05) | ||||||||
Weighted average shares outstanding — basic | 54,618 | 56,039 | ||||||||||||||
Weighted average shares outstanding — diluted | 55,535 | 56,039 | ||||||||||||||
Nine Months Ended September 30, | ||||||||||||||||
2023 | 2022 | |||||||||||||||
(In thousands of U.S. dollars, except per share amounts) | Net Income | Per Share | Net Loss | Per Share | ||||||||||||
Net income (loss) attributable to common shareholders | $ | 22,795 | $ | 0.41 | $ | (25,413) | $ | (0.44) | ||||||||
Adjustments(1): | ||||||||||||||||
Stock-based compensation | 17,110 | 0.31 | 18,651 | 0.33 | ||||||||||||
COVID-19 government relief benefits, net | — | — | (373) | (0.01) | ||||||||||||
Unrealized investment gains | (526) | (0.01) | (98) | — | ||||||||||||
Transaction-related expenses | 3,242 | 0.06 | 955 | 0.02 | ||||||||||||
Executive transition costs | 1,353 | 0.02 | — | — | ||||||||||||
Tax impact on items listed above | (1,184) | (0.02) | (1,071) | (0.02) | ||||||||||||
Adjusted net income (loss)(1) | $ | 42,790 | $ | 0.77 | $ | (7,349) | $ | (0.13) | ||||||||
Weighted average shares outstanding — basic | 54,424 | 57,301 | ||||||||||||||
Weighted average shares outstanding — diluted | 55,261 | 57,301 | ||||||||||||||
(1) | Reflects amounts attributable to common shareholders. | |||||
Free Cash Flow | |||||||||
Nine Months Ended | Nine Months Ended | ||||||||
(In thousands of U.S. Dollars) | September 30, 2023 | September 30, 2022 | |||||||
Net cash provided by operating activities | $ | 54,608 | $ | 481 | |||||
Net cash used in capital expenditures | (18,664) | (23,037) | |||||||
Free cash flow | $ | 35,944 | $ | (22,556) | |||||


View original content to download multimedia:https://www.prnewswire.com/news-releases/imax-corporation-reports-record-q3-2023-results-301966689.html
SOURCE IMAX Corporation
