Market Valuations and Expected Returns - Feb. 5, 2014
The U.S. stock market had an excellent 2013. The performance of all three major U.S. stock indexes was the best since the financial crisis in 2008. The S&P 500 and the Dow Jones Industrial Average continually hit historical highs. Yet the real reason for the bull market is nothing less than QE. Though some investors think the fundamentals of the U.S. economy continued to improve, for most Wall Street analysts, the Fed's $85 billion monthly debt purchase plan is the real driving force behind the bull market.
As investors are happier with the higher balances in their account, they should never forget the word "RISK," which is directly linked to the valuations of the assets they own. A higher current valuation always implies lower future returns.
In 2014, Wall Street has lowered the expectation of the market. Especially after the Fed announced a "taper" to its bond purchases, most of investors and traders have either become bearish or be more cautions to bullish the future stock market.
Up to Jan. 31, 2014, the stock market benchmark S&P 500 lost 3.36% in 2014.
In Third Point's fourth quarter 2013 investor letter, Daniel Loeb believed still-improving global economic conditions would deliver better growth. Although "Street" sentiment has become more negative recently, he expects earnings to rise modestly and the economy overall to surprise to the upside from these increasingly pessimistic projections.
In Baron Funds' fourth quarter report, Ronald Baron pointed out that stocks are at median values for the past century and should be higher. He mentioned, "Interest rates and nominal inflation are important determinants of stock multiples. At current interest rate levels and reported inflation rates, stock multiples should mathematically be meaningfully above the 15.4 times median valuations of U.S. markets for the past one hundred years. Multiples now approximate median valuations. The price to earnings multiple has generally ranged from 10-20. It would not be surprising to us to see the multiple on 2014 earnings increase above the median valuation for the past century. Coupled with expected U.S. GDP growth, that could produce an increase in stock prices of 15-20% during 2014."
In John Hussman's commentary on Feb. 3, 2014, "Pushing Luck," he viewed present market conditions as dangerously speculative.
In Steven Romick's Q4 Commentary for FPA Crescent Fund, he mentioned, "Right now, there's more of the latter so, as you'd expect, our equity exposure declined during 2013. The favorable market allowed us to sell sixteen long equity positions during the year, at an average gain of 64% from cost, with just one generating a loss. We initiated nine new positions. The byproduct of this - unfortunate if the market continues to rally - is that our net equity exposure declined to 51.8%, down from 61.3% a year ago. We will let valuation and risk/reward guide our exposure, not the stock market. If the market gives us tomorrow's prices today and the risk/reward becomes unattractive, then we are unsurprisingly net sellers. Things aren't cheap. Equity values, as a percentage of GDP, are near their peaks. The only time they were higher was at the apex of the dot com bubble."
In Fairholme Fund 2013 Shareholder Letter, Bruce Berkowitz said, "On the macroeconomic front, U.S. fiscal responsibility and U.S. energy independence are on the horizon! Economic progress would eventually lift interest rates, which could depress asset valuations. However, out banks and insurers should more than counter this weight with a lifting of margins between earning assets and paying liabilities. Overall - a net positive."
In T. Rowe Price Equity Income Fund Fourth Quarter Commentary, Brian Rogers said, "Balance sheets remain healthy, with low debt and high cash levels, but top-line growth is muted and profit margins are near their highest levels in decades. Stock valuations are slightly above their long-term averages. We would, therefore, not be surprised to see a correction sometime in 2014. However, we remain constructive on the outlook for equities over the long term, as generally sound fundamentals, improving economic data, and more confident consumers have set the stage for a continuation of the bull market."
According to our last market valuation article, Buffett Indicator and Shiller P/E Both Imply Long Term Negative Market Returns; 2014 Market Valuation, the good news is that our account balance is higher, and investors are more bullish. The bad news is that we will see lower future returns.
GuruFocus hosts three pages about market valuations. The first is the market valuation based on the ratio of total market cap over GDP; the second is the measurement of the U.S. market valuation based on the Shiller P/E. These pages are for the U.S. market. We have also created a new page for international markets. You can check it out here. All pages are updated at least daily. Monthly data is displayed for the international market.
Why Is This Important?
As pointed out by Warren Buffett, the percentage of total market cap (TMC) relative to the U.S. GNP is "probably the best single measure of where valuations stand at any given moment."
Knowing the overall market valuation and the expected market returns will give investors a clearer head on where we stand for future market returns. When the overall market is expensive and positioned for poor returns, the overall market risk is high. It is important for investors to be aware of this and take consideration of this in their asset allocation and investing strategies.
Please keep in mind that the long-term valuations published here do not predict short-term market movement. But they have done a good job predicting the long-term market returns and risks.
Why Did We Develop These Pages?
We developed these pages because of the lessons we learned over the years of value investing. From the market crashes in 2001 to 2002 and 2008 to 2009, we learned that value investors should also keep an eye on overall market valuation. Many times value investors tend to find cheaper stocks in any market. But a lot of times the stocks they found are just cheaper, instead of cheap. Keeping an eye on the overall market valuation will help us to focus on absolute value instead of relative value.
The indicators we develop focus on the long term. They will provide a more objective view on the market.
Ratio of Total Market Cap over GDP - Market Valuation and Implied Returns

The information about the market valuation and the implied return based on the ratio of the total market cap over GDP is updated daily. The total market cap as measured by Wilshire 5000 index is now 109% of the US GDP. We can see the equity values as the percentage of GNP are near their peaks. The only time they were higher was at the apex of the dot-com bubble. The stock market is likely to return about 2.5% a year in the coming years. The stock market is modestly overvalued. As a comparison, at the beginning of 2013, the ratio of total market cap over GDP was 97.5%, and it was likely to return 4% a year from that level of valuation.
For details, please go to the daily updated page. In general, the returns of investing in an individual stock or in the entire stock market are determined by these three factors:
1. Business growth
If we look at a particular business, the value of the business is determined by how much money this business can make. The growth in the value of the business comes from the growth of the earnings of the business growth. This growth in the business value is reflected as the price appreciation of the company stock if the market recognizes the value, which it does, eventually.
If we look at the overall economy, the growth in the value of the entire stock market comes from the growth of corporate earnings. As we discussed above, over the long term, corporate earnings grow as fast as the economy itself.
2. Dividends
Dividends are an important portion of the investment return. Dividends come from the cash earning of a business. Everything equal, a higher dividend payout ratio, in principle, should result in a lower growth rate. Therefore, if a company pays out dividends while still growing earnings, the dividend is an additional return for the shareholders besides the appreciation of the business value.
3. Change in the market valuation
Although the value of a business does not change overnight, its stock price often does. The market valuation is usually measured by the well-known ratios such as P/E, P/S, P/B etc. These ratios can be applied to individual businesses, as well as the overall market. The ratio Warren Buffett uses for market valuation, TMC/GNP, is equivalent to the P/S ratio of the economy.
Putting all the three factors together, the return of an investment can be estimated by the following formula:
Investment Return (%) = Dividend Yield (%)+ Business Growth (%)+ Change of Valuation (%)
From the contributions we can get the predicted return of the market.
The Predicted and the Actual Stock Market Returns
This model has done a decent job in predicting the future market returns. You can see the predicted return and the actual return in the chart below.
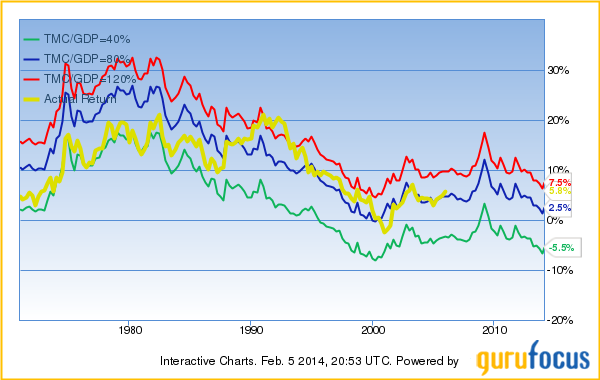
The prediction from this approach is never an exact number. The return can be as high as 7.5% a year or as long as -5.5% a year, depending where the future market valuation will be. In general, investors need to be cautious when the expected return is low.
Shiller P/E - Market Valuation and Implied Returns
The GuruFocus Shiller P/E page indicates that the Shiller P/E is 24.3. This is 47.3% higher than the historical mean of 16.5. Implied future annual return is 1.6%.
The Shiller P/E chart is shown below:
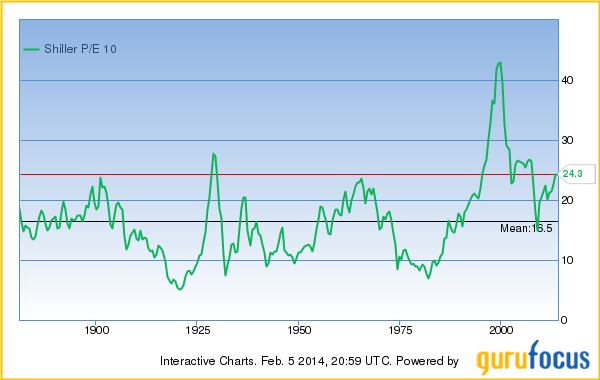
Over the last decade, the Shiller P/E indicated that the best time to buy stocks was March 2009. However, the regular P/E was at its highest level ever. The Shiller P/E, similar to the ratio of the total market cap over GDP, has proven to be a better indication of market valuations.
Overall, the current market valuation is more expensive than in the most part of the last 130 years. It is cheaper than most of the time over the last 15 years.
To understand more, please go to GuruFocus' Shiller P/E page.
John Hussman's Peak P/E:
John Hussman presently estimates prospective 10-year S&P 500 nominal total returns averaging just 2.7% annually, with negative expected total returns on every horizon shorter than seven years.
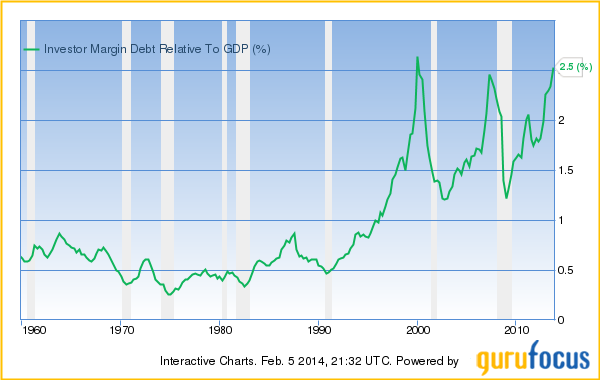
In his commentary on February 3, 2014, "Pushing Luck," he said "The latest data from the NYSE shows equity margin debt at a new all-time high. Relative to GDP, the current 2.6% level was eclipsed only once - at the March 2000 market peak. In the context of the most extreme bullish sentiment in decades, and reliable valuation metrics about double their historical norms prior to the late-1990's bubble (price/revenue, market cap/GDP, Tobin's Q, properly normalized price/forward operating earnings, price to cyclically-adjusted earnings), we view present market conditions as dangerously speculative."

In all the three approaches discussed above, the fluctuations of profit margin are eliminated by using GDP, the average of trailing 10-year inflation-adjusted earnings, and peak-P/E, revenue, or book value etc. Therefore they arrive at similar conclusions: The market is overvalued, and it is likely to return only 1.6-2.7% annually in the future years.
Jeremy Grantham's 7-Year Projection:
Jeremy Grantham's firm GMO publishes a monthly 7-year market forecast. According to Ben Inker and James Montier's 3Q letter Breaking News! U.S. Equity Market Overvalued! and Ignoble Prizes and Appointments, Jeremy Grantham (Trades, Portfolio) believed "investors should be aware that the U.S. market is already badly overpriced - indeed, we believe it is priced to deliver negative real returns over seven years [GMO estimates fair value for the S&P 500 at 1100]. In our view, prudent investors should already be reducing their equity bets and their risk level in general. One of the more painful lessons in investing is that the prudent investor (or "value investor" if you prefer) almost invariably must forego plenty of fun at the top end of markets. This market is already no exception, but speculation can hurt prudence much more and probably will. Be prudent and you'll probably forego gains. Be risky and you'll probably make some more money, but you may be bushwhacked and if you are, your excuses will look thin. My personal view is that the path of least resistance for the market will be up."
As of December 31, 2013, GMO's 7-year forecast is below:
Stocks | |||
US Large | -1.7% | Intl Large | 1.0% |
US Small | -4.9% | Intl Small | 0.6% |
US High Quality | 2.1% | Emerging | 3.5% |
Bonds | |||
US Bonds | 1.0% | Inflation Linked Bonds | 1.1% |
Intl Bonds Hedged | -1.9% | Cash | -0.4% |
Emerging Debt | 2.9% | ||
Other | |||
Timber | 5.9% |
Source:
https://www.gmo.com/America/CMSAttachmentDownload.aspx?target=JUBRxi51IIAFW%2b%2b6pwBshGfRBwPbv%2f8%2fHzu5lQTiWjNTxL8MQFpkScn6eCNcZuuoU%2bebbxIRKlZ4VPTgJOGfah1I%2fSs9Lj%2b7mATbwEOUrD4%3d
GMO expected US large cap real return is -1.7%. This number does not agree with what we find out with market/GDP ratio and Shiller P/E ratio. The US high quality's return is expected to be 2.1% a year.
Insider Trends
As indicated by the three different approaches discussed above, the best buying opportunities over the last five years appeared when the projected returns were at their highest level from October 2008 to April 2009, when investors could expect 10% a year from the U.S. market.
If average investors missed this opportunity, corporate insiders such as CEOs, CFOs and directors did not. As a whole they purchased their own company shares at more than double the normal rate from October 2008 to April 2009. Many of these purchases resulted in multi-bagger gains. This confirmed again the conclusions of earlier studies: The aggregated activities of insiders can serve as a good indicator for locating the market bottoms. Insiders as a whole are smart investors of their own companies. They tend to sell more when the market is high, and buy more when the market is low.
This is the current insider trend for S&P 500 companies:
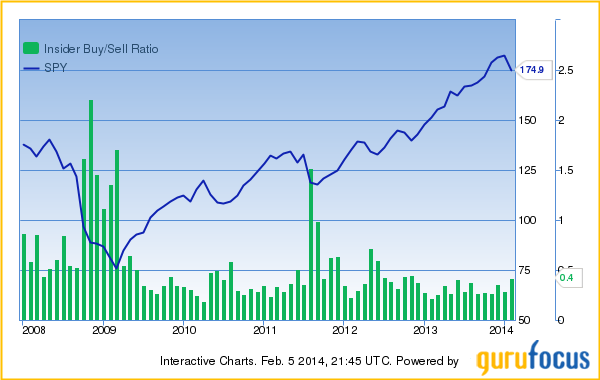
The latest trends of insider buying are updated daily at GuruFocus' Insider Trend page. Data is updated hourly on this page. The insider trends of different sectors are also displayed in this page. The latest insider buying peak is at this page: September of 2011, when the market was at recent lows.
Conclusion: The stock market is not cheap as measured by long term valuation ratios. It is positioned for about 1.6-2.7% of annual returns for the next decade. By watching the overall market valuations and the insider buying trends investors will have a better understanding of the risk and the opportunities. The best time to buy is when the market valuation is low, and insiders are enthusiastic about their own company's stocks.
Investment Strategies at Different Market Levels
The Shiller P/E and the ratio of total market cap over GDP can serve as good guidance for investors in deciding their investment strategies at different market valuations. Historical market returns prove that when the market is fair or overvalued, it pays to be defensive. Companies with high quality business and strong balance sheet will provide better returns in this environment. When the market is cheap, beaten down companies with strong balance sheets can provide outsized returns.
To summarize:
1. When the market is fair valued or overvalued, buy high-quality companies such as those in the Buffett-Munger Screener.
2. When the market is undervalued, buy low-risk beaten-down companies like those in the Ben Graham Net-Net Screener. Buy a basket of them and be diversified.
3. If market is way over valued, stay in cash. You may consider hedging or short.
If you are not a Premium Member, we invite you for a 7-day Free Trial .
This article first appeared on GuruFocus.
Related Articles
