NZD/USD Technical Analysis 04.09.2013
NZD/USD Technical Analysis– Prices are testing resistance at 0.8471, the 50% Fibonacci expansion, with a break below that targeting the 61.8% level at 0.8544. Near-term support is at 0.8398, the 38.2% Fib. A drop below that eyes the 23.6% expansion at 0.8307.
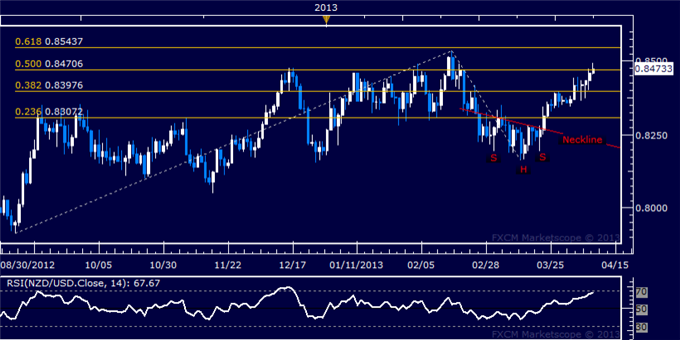
Daily Chart - Created Using FXCM Marketscope 2.0
Want to back-test your technical trading strategy? Download the historical data here.
--- Written by Ilya Spivak, Currency Strategist for Dailyfx.com
To contact Ilya, e-mail ispivak@dailyfx.com. Follow Ilya on Twitter at @IlyaSpivak
To be added to Ilya's e-mail distribution list, please CLICK HERE
New to FX? Watch this Video. For live market updates, visit the Real Time News Feed
DailyFX provides forex news and technical analysis on the trends that influence the global currency markets.
Learn forex trading with a free practice account and trading charts from FXCM.
