Stalking British Pound Trade and Deciphering Divergent Markets
The GBPUSD is at a point where the opportunistic trader might take advantage of a high price. A Nikkei 225 / S&P 500 comparison tells a story that can be played through USDMXN. Divergences between closely related currencies suggest a near term US Dollar turn.
GBPUSD
Weekly
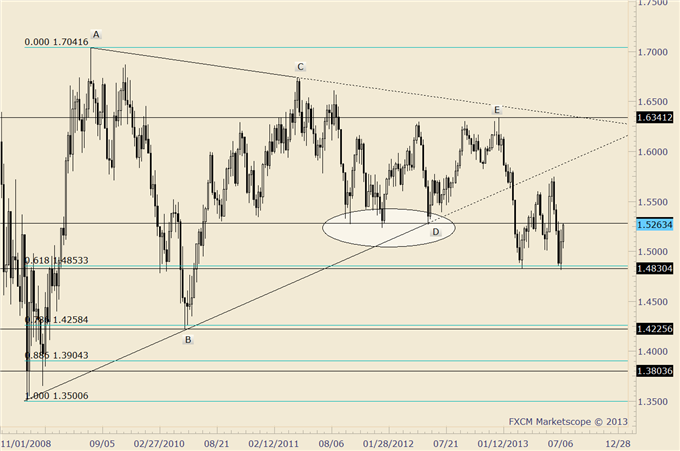
Chart Prepared by Jamie Saettele, CMT using Marketscope 2.0
Interested in automated trading with Mirror Trader?
FOREXAnalysis: Bigger picture GBPUSD bearish logic goes something like this; a 4 year triangle was broken to the downside in February. The market found bottom in March and rallied in 3 waves, eventually failing at the February breakdown level. The rally that commenced last week has already erased half (exactly…1.5281 is also the rolling 13 week midpoint) of the decline from the June top. Don’t forget, the high for the year was made on the first trading day of the year (significant when one considers the distribution of highs and lows within a calendar year). Ultimately, the long term triangle break portends a return to 1.3500 although 1.4225/58 is a level to keep in mind as support.
There are concerns of course, including last week’s reversal. The market confirmed the reversal with follow through this week. There are always 2 sides though and the reversal doesn’t erase the implications from the 4 year triangle break. Looking strictly at price, the current level was huge support in 2011 and 2012. A main tenet of technical analysis is that former support becomes resistance and vice versa. Cable is at former support…it’s reasonable to expect resistance.
FOREX Trading Strategy: Currently short from 1.5190 with 1.5310 stop. That stop might not be safe but such is trading. If stopped out then will be looking for resistance near this short term upward sloping trendline.
GBPUSD
Daily

Chart Prepared by Jamie Saettele, CMT using Marketscope 2.0
Interested in automated trading with Mirror Trader?
Nikkei 225 and S&P 500 Futures Contracts (September)
Daily

Chart Prepared by Jamie Saettele, CMT
Interested in automated trading with Mirror Trader?
FOREXAnalysis: In just 4 weeks, the S&P 500 has levitated to record highs. Juxtaposed next to the Nikkei, there is reason to question the excitement…if not turn outright bearish. The new S&P high is not confirmed by Nikkei action. Support becoming resistance and vice versa holds true for trendlines as well. Both markets have traded to the underside of former support lines. It is reasonable to expect resistance here. Market leaders are also flashing warning signs.
FOREX Trading Strategy: Looking to play a stock market reversal through USDMXN. I covered USDJPY at the end of Friday’s DailyFX PLUS webinar.
USDMXN
Daily
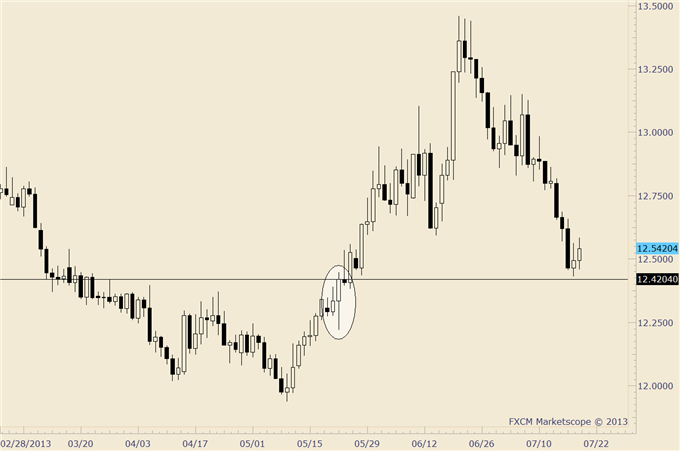
Chart Prepared by Jamie Saettele, CMT using Marketscope 2.0
Interested in automated trading with Mirror Trader?
FOREXAnalysis: 5/22 is an important day. That is the Nikkei top and it was the S&P top. It was also a large volume day across many markets, including USDMXN. The close of that day is estimated support at 12.42. Near term wave structure suggests one final low before a turn.
FOREX Trading Strategy: Looking for a tradeable low next week.
EURUSD and USDCHF
Daily
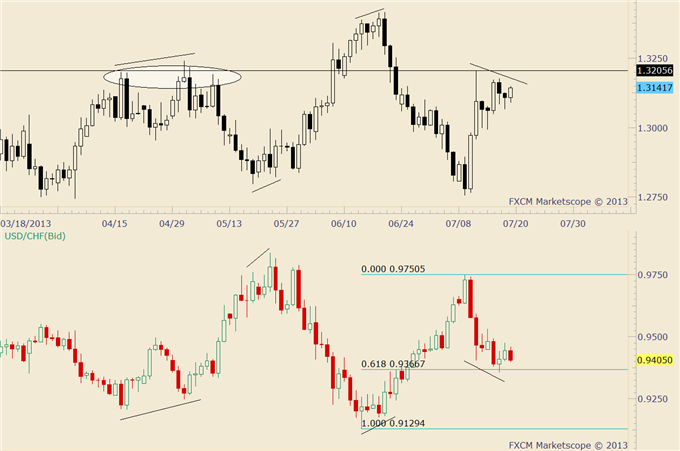
Chart Prepared by Jamie Saettele, CMT using Marketscope 2.0
Interested in automated trading with Mirror Trader?
FOREXAnalysis: Not much to add from the Daily Technicals, but I want to highlight the divergence currently in place. “The USDCHF drop below its 7/11 low creates divergence with the EURUSD, which is in place as long as the EURUSD is below the 7/11 high. It’s also possible that a flat correction is complete from the 7/11 low in EURUSD. The USDCHF turned higher on Wednesday from the 61.8% retracement of the rally from .9129.”
FOREX Trading Strategy: Currently long USDCHF from .9411. Stop .9350. If stopped out then will be looking for turns near EURUSD 1.3270/90 and USDCHF .9290 or .9220.
AUDUSD and NZDUSD
Daily

Chart Prepared by Jamie Saettele, CMT using Marketscope 2.0
Interested in automated trading with Mirror Trader?
FOREXAnalysis: I have cited pattern, momentum and sentiment as reasons to look for an AUDUSD reversal in recent weeks but it hasn’t happened so one must consider alternatives. Since June, each tradeable top has been marked by divergence with NZDUSD (NZDUSD exceeds a pivot high and AUDUSD does not). That happened again today and is in place as long as AUDUSD is below .9343.
Markets correct extremes in sentiment and momentum (which go hand in hand) through a combination of time and price. Sometimes more price…sometimes more time. The AUDUSD has corrected almost exclusively through time. Consider that since May 1st, price has declined nearly 14 big figures (1383 pips) from high to low and the largest rally since then has been 340 pips (6/11-6/14). Similar rallies occurred from 5/29-6/3 (263 pips) and 7/12-7/17 (294 pips). Introduce time into the equation and the momentum extremes that were evident through June have moderated. 20 day rate of change is just -.23.
FOREX Trading Strategy:As long as the AUDUSD is below .9343, longs are at risk. I’ll be an observer of this market however. Efforts need to be concentrated on perceived better opportunities (GBPUSD, USDMXN, USDCHF).
--- Written by Jamie Saettele, CMT, Senior Technical Strategist for DailyFX.com
To contact Jamie e-mail jsaettele@dailyfx.com. Follow him on Twitter @JamieSaettele
Subscribe to Jamie Saettele's distribution list in order to receive actionable FX trading strategy delivered to your inbox.
Jamie is the author of Sentiment in the Forex Market.
DailyFX provides forex news and technical analysis on the trends that influence the global currency markets.
Learn forex trading with a free practice account and trading charts from FXCM.
