
Stock at a Major Breakout Juncture Could Return Fast Profits
In the past two years, Sprint Nextel Corp. (NYSE:S) has seen more swings than a playground. Since October, it has been in a consolidation phase during which a series of higher lows has pushed the stock up to a resistance line near the $6 mark. Thus, Sprint appears to be coiling up and ready to spring higher in the near future.
After a major fall from grace above $70 in late 1999, the stock didn't find its bottom until late 2008 (talk about a lost decade) under $2. Since then, it has staged several meaningful (huge in percentage terms) rallies, each of which lost steam near $6.
In recent months, the stock has again worked itself higher and toward this significant, multi-year resistance level (horizontal blue line).

Strong breakout setups tend to look good in multiple time frames, and such is the case with Sprint stock.
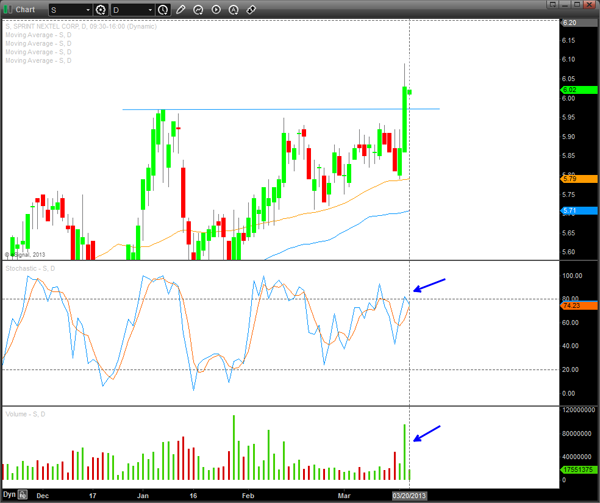
On the weekly chart above, the resistance points from May 2009, June 2011 and October 2012 shape the longer-term resistance. Closer up on the daily chart below, we can see resistance at the same level formed with points on Oct. 11, Jan. 8, and Feb. 12.
The multiple time frames of this resistance level are important because a good break above it will likely be followed by different types of traders. Institutional types who look at weekly charts should be enticed to buy the stock on a weekly break above $6, while shorter-term traders will look to buy the stock on a break above that level on a daily closing basis like we saw this week.

Also note the series of higher lows since October, marked by the blue bubbles and arrows. From a purely price action point of view, this "churning" below resistance looks and feels like a coiled up spring, ready to bounce higher.
This series of higher lows needed a higher high to confirm a breakout past resistance. On Tuesday, March 19, Sprint finally saw a higher high on a daily closing basis. The stock rallied 3% on the day, accompanied by a huge spike in volume and still supportive momentum indicators.
The chart below shows the stochastics indicator still has room to move into deeper overbought territory. One could point to potential bearish negative divergence between price and momentum with stochatics thus far not having made a higher high, i.e., not confirmed the breakout in price. However, the massive spike in volume on the breakout day should overrule the lagging momentum and eventually lead to higher prices and momentum.
Given that the broader U.S. stock market is starting to show signs of slowing, chasing any stock higher at this point is a low-probability strategy in my book. Relatively speaking, though, Sprint has underperformed the S&P 500, and while that alone should not make the case to buy the stock, combined with the technical strength of the setup discussed above, Sprint looks set to outperform in the near future.
Recommended Trade Setup:
-- Buy S at the market price
-- Set stop-loss at $5.80
-- Set initial price target at $6.50 for a potential 8% gain in 6-8 weeks
Related Articles
Low-Frequency Trading System Provides an Edge Over Day Trading and Buy and Hold
System Says These 2 Relative Unknowns are the Best Mid-Cap Stocks to Buy
A Simple Way to Triple the Traditional Income You Receive From This Dividend Stock
