US Dollar Chart Setup Warns of Downward Reversal Ahead
THE TAKEAWAY: The US Dollar has produced a bearish chart pattern hinting a reversal downward is ahead. The S&P 500 is testing higher en route to the index’s record high.
US DOLLAR TECHNICAL ANALYSIS– Prices appear to have completed a bearish Head and Shoulders chart pattern. Initial support is at 10423, the 23.6% Fibonacci retracement. A break beneath that exposes the 38.2% Fib at 10329 and the implied H&S target at 10312. Near-term resistance is at 10514, the March 20 high.

Daily Chart - Created Using FXCM Marketscope 2.0
S&P 500 TECHNICAL ANALYSIS – Prices are testing resistance at 1565.60, the 38.2% Fibonacci expansion, with a break higher targeting the 1575.00-76.10 area marked by the 50% level and the index’s record high. Near-term support is at 1534.90, the March 18 low.

Daily Chart - Created Using FXCM Marketscope 2.0
GOLD TECHNICAL ANALYSIS – Prices are approaching support at 1597.76, the 14.6% Fibonacci expansion, with a break lower exposing the 23.6% level at 1586.30. Near-term resistance is at 1616.98, the March 21 high. A move above that aims for a longer-term falling trend line at 1642.66.
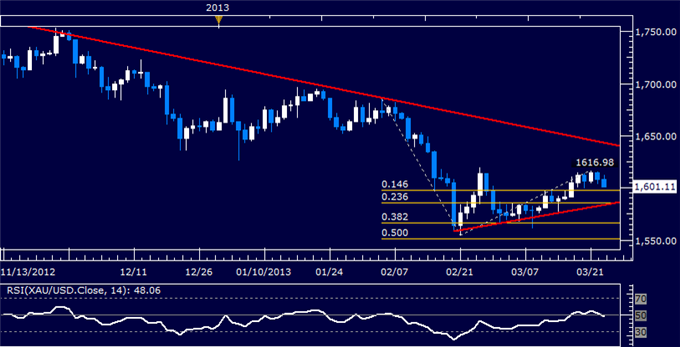
Daily Chart - Created Using FXCM Marketscope 2.0
CRUDE OIL TECHNICAL ANALYSIS– Prices are testing resistance at 94.07, the March 19 swing high, with a break higher on a daily closing basis targeting 95.51. A break above that targets trend line resistance at 96.33. Near-term support is at 91.97, the 23.6% Fibonacci expansion.
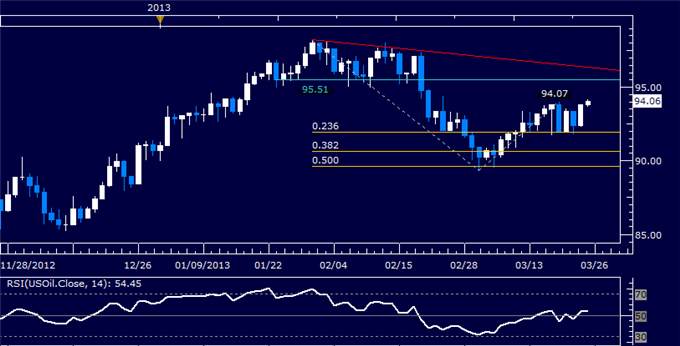
Daily Chart - Created Using FXCM Marketscope 2.0
--- Written by Ilya Spivak, Currency Strategist for Dailyfx.com
To contact Ilya, e-mail ispivak@dailyfx.com. Follow Ilya on Twitter at @IlyaSpivak
To be added to Ilya's e-mail distribution list, please CLICK HERE
New to FX? Watch this Video. For live market updates, visit the Real Time News Feed
DailyFX provides forex news and technical analysis on the trends that influence the global currency markets.
Learn forex trading with a free practice account and trading charts from FXCM.
