US Dollar Slumps to Trend Support, SPX 500 Back at Record Highs
Talking Points
US Dollar Slumping Back to Five-Month Trend Support
S&P 500 Returns to Augusts’ Record High Once Again
Gold Finds Interim Support Above the $1300/oz Mark
To receive Ilya's analysis directly via email, please SIGN UP HERE
Can’t access to the Dow Jones FXCM US Dollar Index? Try the USD basket on Mirror Trader. **
US DOLLAR TECHNICAL ANALYSIS – Prices are pushing through support in the 10631-46 area marked by the August 16 low and the 50% Fibonacci expansion to challenge the 61.8% level at 10588. A break below that aims for a rising trend line set from early April, now at 10571. Near-term resistance is at 10673, the 38.2% Fib.

Daily Chart - Created Using FXCM Marketscope 2.0
** The Dow Jones FXCM US Dollar Index and the Mirror Trader USD basket are not the same product.
S&P 500 TECHNICAL ANALYSIS – Prices are testing through resistance at 1701.80, the 50% Fibonacci expansion, to challenge the August swing high at 1709.60. A further push above that aims for the 61.8% Fib at 1719.60. Alternatively, a reversal back below 1701.80 targets the 38.2% level at 1684.10.
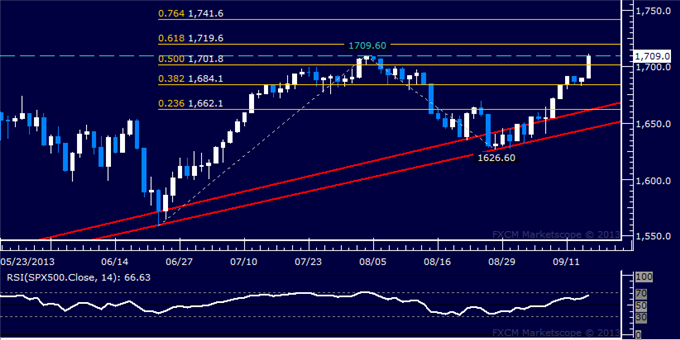
Daily Chart - Created Using FXCM Marketscope 2.0
GOLD TECHNICAL ANALYSIS – Prices broke below the bottom of a rising channel set from late-June and cleared the 1347.52-60.96 region marked by a horizontal pivot as well as the 23.6% Fibonacci expansion. Sellers are now challenging the 38.2% level at 1316.01, with a break below that aiming for the 50% Fib at 1279.68. The 1347.52 mark is now acting as near-term resistance.
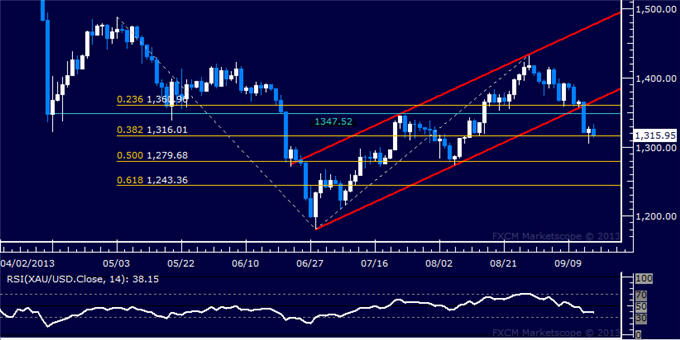
Daily Chart - Created Using FXCM Marketscope 2.0
CRUDE OIL TECHNICAL ANALYSIS– Prices declined as expected after putting in a bearish Dark Cloud Cover candlestick pattern. Near-term support is at 105.93, the 23.6% Fibonacci retracement, with a break below that targeting the bottom of a rising channel set from early July (now at 104.32). Channel resistance is at 110.65.

Daily Chart - Created Using FXCM Marketscope 2.0
--- Written by Ilya Spivak, Currency Strategist for DailyFX.com
Contact and follow Ilya on Twitter: @IlyaSpivak
For live market updates, visit the Real Time News Feed
DailyFX provides forex news and technical analysis on the trends that influence the global currency markets.
Learn forex trading with a free practice account and trading charts from FXCM.
