Warren Buffett Didn't Tell You This About Investing
When it comes to investment Warren Buffett is the best there is. His wisdom is beyond comparison and has permeated all corners of the investing and trading world.
His main advice is invest don't speculate, find value, pick businesses that even fools can run because one day they will. He recommends buying when others are fearful and selling when others are greedy. He claims to like when stocks go down because he buys more; he won't jump the ship.
His suggestions are difficult to argue with. His track record definitely speaks for itself and may be your worst prosecutor in a debate.
The good investor must pick the right stocks for his portfolio, good price/earnings ratio, the right leverage and a growing company in the best-performing industry. But how can you determine if it is the wrong moment?
CBOE Volatility Index VIX - called "fear gauge" by many - was launched by the CBOE in 1993 to track the options activity in the Standard & Poor's 500. When investors perceive future events may affect the overall health of the market (i.e., an interest rate hike, China manufacturing data, etc.), they go ahead and protect their portfolios buying call and put options (options work as an insurance for up/call or down/put movements; most use them when either short or long in the same order).
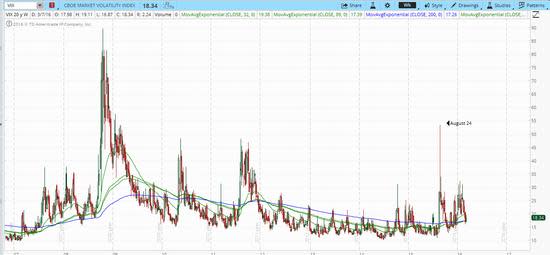
The bigger the fear, investors buy larger amounts of protection as seen last Aug. 24; the VIX reached its highest point 53 since 2009.
That peak took the S&P 500 to correction territory; from then on markets have been navigating through ups and downs draining lots of money from investors, but mostly changing hands from the many to the few on top of the Wall Street food chain.
Investors should be aware of the index movements in order to stay inside or outside the market. The following chart might give us a hint:
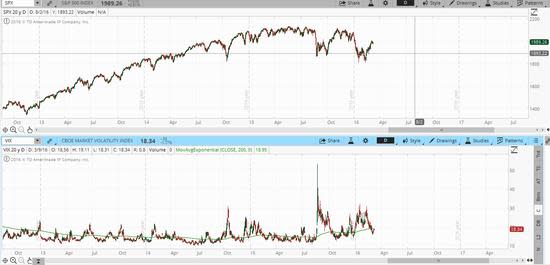
As you can see when the VIX jumps above the 200 EMA (Exponential Moving Average, green line) the S&P 500 has a potential correction above 3% in most cases. This is seen clearly in October 2014, August 2015 and just now at the beginning of 2016.
So if you are planning to go long a stock, with a beta of 1 to the S&P 500, when the VIX is above this 200 EMA, most likely you will lose at least 3% right from the beginning. Even though last year's market stalled around 2,100 for the S&P 500, the VIX stood most of the time below the 200 EMA. There was plenty of time to go long, so better wait .
Where are we now?
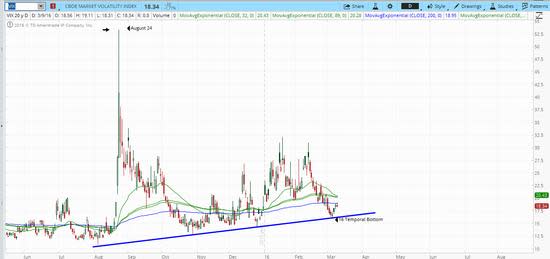
Since Aug. 24 the VIX has stayed above the trend line shown on the preceding graph. It did bounce against it in the last four days, and it's heading north. Long-term investors, the ones following Buffett's steps, should stay out of the market until the gauge shows a down trending pattern.
Whichever fundamental analysis you made on your stock picks will be diminished by this overall Systemic Market Risk. Wait until the market slows down, and prices come to their senses.
Let's remember oil prices are said to be in oversold territory since they have gained around 35% since their bottom. We have the latest China manufacturing data bringing down its stock market, Brexit, Draghi discussion following policy action and the upcoming FED meeting on March 15-16.
Buffett's recommendations are the closest to the holy grail. You should not only follow them but enhance your abilities to make decisions within their guidance. Adding the CBOE Volatility Index to your fundamental analysis could really save you from cold feet if you see your positions going south in the short term.
This article first appeared on GuruFocus.
