2 Retail Stocks to Short
Yesterday, retail stocks American Eagle Outfitters (NYSE:AEO) and Abercrombie & Fitch Co (NYSE:ANF) were in focus after reaffirming their respective fourth-quarter sales forecasts. While the retailers aren't slated to report their full holiday-season results until the first week of March, both stocks could run into technical trouble soon, if history is any guide.
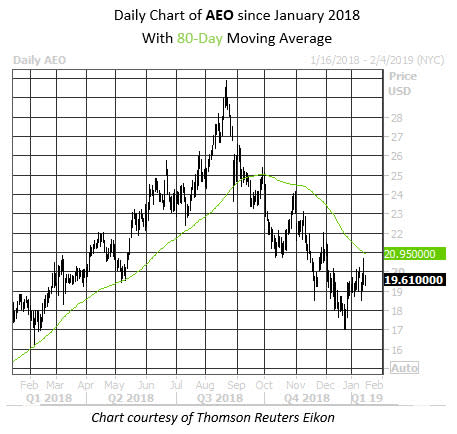
American Eagle Stares Up at Trendline Resistance
Looking at AEO first, the security is trading within one standard deviation of its 80-day moving average. After the last five times American Eagle rose to test resistance at this moving average after a lengthy stretch below it, the equity was down 3.4%, on average, one month out, with 80% of those returns negative, per data from Schaeffer's Senior Quantitative Analyst Rocky White.
At last check, American Eagle stock is down 0.8% to trade at $19.61, so a move of similar magnitude would drop the retailer's shares back below $19 by this time next month. AEO is already down 34.4% from its Aug. 22 high of $29.88.
In the options pits, the mood is almost exclusively favored toward puts. At the International Securities Exchange (ISE), Chicago Board Options Exchange (CBOE), and NASDAQ OMX PHLX (PHLX), AEO's 10-day put/call volume ratio of 14.02 ranks in the 97th percentile of its annual range, meaning puts have been bought to open at a near-climactic pace relative to calls in the last two weeks.
For those looking to speculate on another leg lower for the retailer, it's an attractive time to buy premium on short-term AEO options. The security's Schaeffer's Volatility Index (SVI) of 42% ranks in the 19th percentile of its annual range, indicating near-term contracts are pricing in relatively low volatility expectations at the moment.
Abercrombie Sell Signal Flashes Again
Turning to Abercrombie & Fitch, the stock is trading within one standard deviation of its 320-day moving average. Following the last two times ANF tested resistance at this moving average after a lengthy stretch below it, the equity was down 10.3%, on average, one month out, with half of those returns negative, per data from White.

The retail stock is currently treading water at its year-over-year breakeven point, with ANF down 0.5% to trade at $19.02. An "average" 10% retreat from its 320-day moving average would put the retail stock around $17 in a month's time, in the neighborhood of its December lows.
As far as options are concerned, ANF stock's Schaeffer's put/call open interest ratio (SOIR) of 1.65 sits in the 100th percentile of its annual range, indicating that near-term traders are more put-biased now than at any other time in the past 12 months.
Like its retail peer, ANF options are attractively priced, per the stock's SVI of 52%. This reading ranks in the 14th annual percentile, meaning short-term options are pricing in lower-than-usual volatility expectations -- which means premium buyers can make the most of the leverage and convexity afforded by options relative to trading shares outright.
