3 Big Stock Charts for Friday: Twitter, Macy’s and Kimco Realty
Thursday’s loss marks the fourth setback in five days for the S&P 500, indicating a struggle under the weight of its oddly bullish August.
Facebook (NASDAQ:FB) did the most net damage to the market, losing 2.8% of its value after the company’s shortcomings were exposed and highlighted as part of a Congressional hearing. Tech hardware stocks actually took bigger losses though. Micron Technology (NASDAQ:MU) fell nearly 10% against a backdrop of worry that the recent strong demand for memory chips was close to evaporating. Advanced Micro Devices (NASDAQ:AMD), meanwhile, tumbled to the tune of 2.4% for no particular reason other than major profits are there for the taking thanks to last month’s impressive gains.
None of yesterday’s winners were especially noteworthy.
InvestorPlace - Stock Market News, Stock Advice & Trading Tips
Headed into the beginning of the last day of the holiday-shortened trading week, stock charts of Macy’s (NYSE:M), Twitter (NYSE:TWTR) and Kimco Realty (NYSE:KIM) are looking compelling… mostly for bearish reasons.
Macy’s (M)
Retail stocks may have sizzled between February and August, but the sheer scope and size of those gains has made them vulnerable to profit-taking.
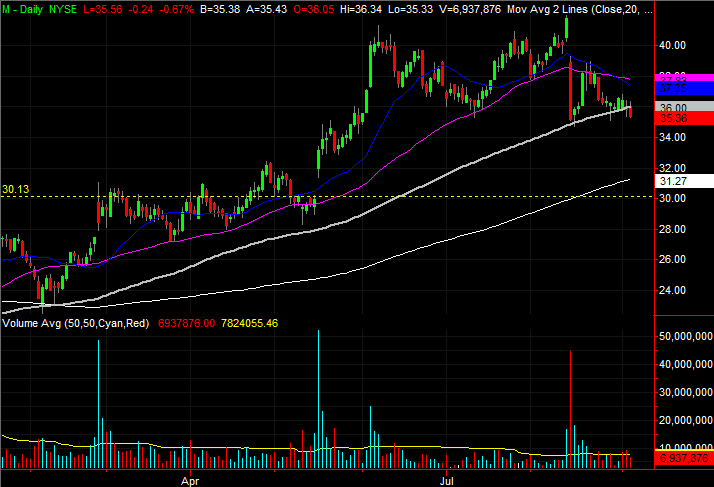
Macy’s is no exception to that norm. Although M stock advanced more than 80% from its February low to last month’s peak, the sellers haven’t been shy about dumping it. Indeed, thanks to Thursday’s relatively modest lull, Macy’s shares are officially in significant technical trouble.
• The “technical trouble” is the move below the 100-day moving average line (gray). After last month’s plunge, it looked like M shares were going to find enough support there to stage a rebound. That’s no longer the case.
• Beckoning the stock lower may be an unconscious effort to go back and fill in the bullish gap left behind in May, near $30.
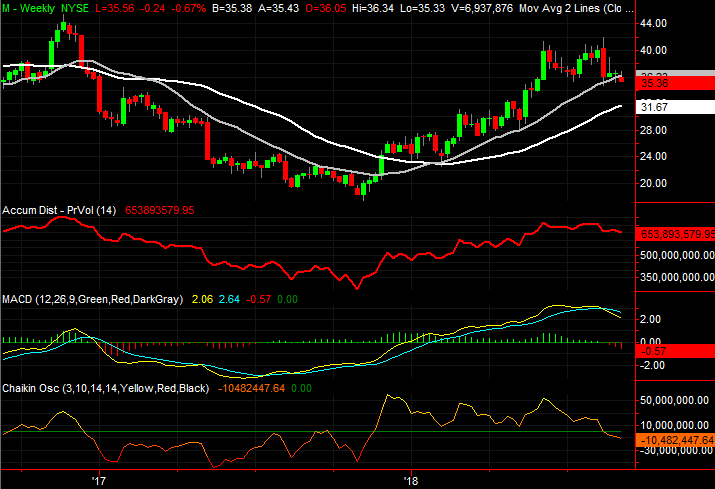
• The undertow on the weekly chart has actually been bearish for a while, as suggested by both volume-based indicators. The Chaikin line is below zero, and the accumulation-distribution line is on the verge of moving to a multi-week low.
Twitter (TWTR)

Twitter, along with several other social media and internet companies, have been thrust into a spotlight they didn’t want to be under. As was noted above, a Congressional committee is probing — publicly — into how they operate, and things none of these organizations are remaining unscathed.
It would be naive to suggest this is the one and only reason TWTR shares have broken down this week. It looks like this selloff had already been mapped out, and the sellers just needed an excuse. The reason, though, is irrelevant. What matters is what happened, and how Thursday’s action could be the beginning of a more serious bearish wave.
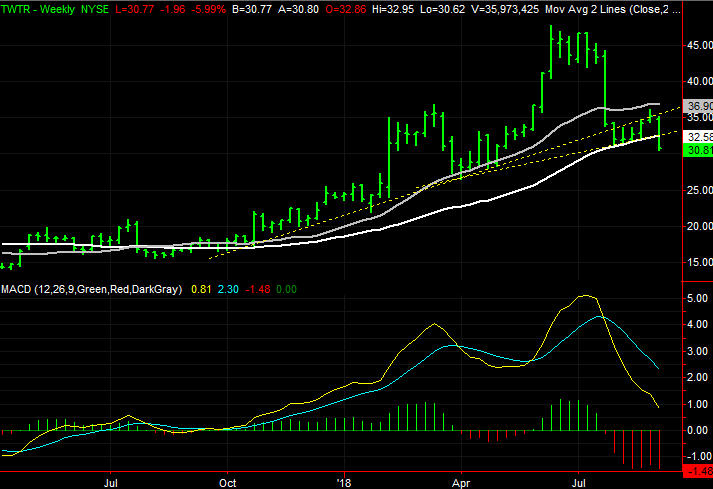
• Like Macy’s, Twitter shares broke under a key moving average line yesterday … the 200-day line (white) at $32.10. TWTR also broke below the late-July low, though, leaving no plausible technical floor anywhere in sight.
• Zooming out to the weekly chart we can see that Twitter has also broken below two critical support levels.
• Ideally, ironically, the most bearish scenario that could develop from here is one last recovery attempt that fails followed by a renewal of the downtrend. Anything less, and the weakness has neither been tested nor confirmed.
Kimco Realty (KIM)

Last but not least, it may have more to do with the backdrop of brewing market weakness than Kimco Realty itself. But, the reason is irrelevant. What matters is that the perceived need for safety is (and has been for a while) funneling buyers into REITs, and into KIM in particular. If KIM isn’t over a major technical hump yet, it’s certainly getting close.
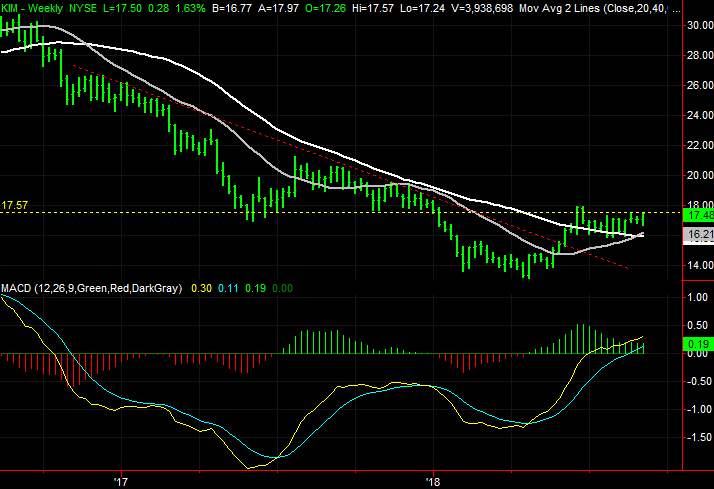
• On the daily chart, the resistance level at $17.32 (red, dashed) has already been breached, though on the weekly chart the ceiling is closer to $17.57 (yellow, dashed). Both really need to be decisively hurdled to get the proverbial “green light,” but we’re moving in that direction.
• Traders also have to like the way a couple of the key moving average lines on the daily chart have acted as support, providing a pushoff point for the rally that was rekindled yesterday.
• Zooming out to a weekly chart of KIM, we can see the falling resistance line (red, dashed) that had been guiding the stock lower in all of 2017 has already been cleared. We can also see the 100-day moving average line (gray) is above the 200-day line (white) for the first time in over a year.
As of this writing, James Brumley did not hold a position in any of the aforementioned securities. You can follow him on Twitter, at @jbrumley.
More From InvestorPlace
The post 3 Big Stock Charts for Friday: Twitter, Macy’s and Kimco Realty appeared first on InvestorPlace.
