3 Big Stock Charts for Monday: Coca-Cola, Kinder Morgan and Adobe
Meh. The market may have logged a loss on Friday, with the S&P 500 falling 0.65%. But, after three days of sizeable gains that appear to have snapped the downtrend, most traders were OK with the bit of profit-taking headed into the weekend.
Besides, a huge part of the pullback was attributed to one company. Apple (NASDAQ:AAPL), still the world’s biggest company, was off to the tune of 6.6% following its fiscal-fourth-quarter report that was less than hoped. But, the bulk of the revolt might have had more to do with the fact that the company is no longer going to report iPhone unit sales.
AcelRx Pharmaceuticals (NASDAQ:ACRX) was up 15.6% mostly on news that its opioid pain drug has been approved by the FDA, Though investors may have also bought in before the company’s post-close release of its third-quarter numbers.
InvestorPlace - Stock Market News, Stock Advice & Trading Tips
There just weren’t enough names like ACRX to lift the broad market out of the red.
Headed into today’s action following Friday’s mostly uncommitted action, stock charts of Coca-Cola (NYSE:KO), Kinder Morgan (NYSE:KMI) and Adobe (NASDAQ:ADBE) are shaping up as your best trading bets. Here’s a look at what’s already happened, and what’s apt to happen next.
Coca-Cola (KO)
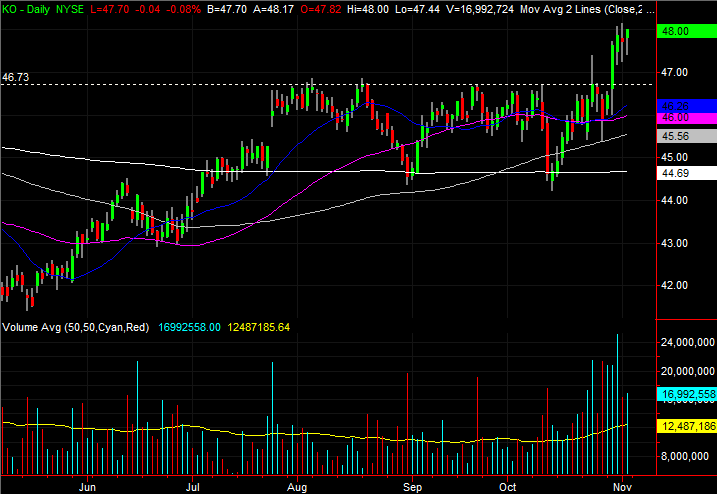
Coca-Cola shares had been trapped in a trading range as of August, but that range was finally broken this week. Though we’re still likely to see some back-and-forth action, a lot of hard work has been done, and the bulls have tipped their hand.
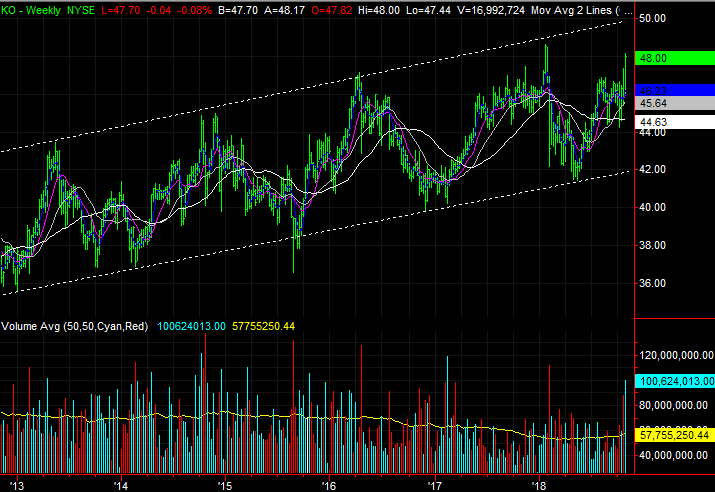
And, when framing the near-term uptrend within the context of a much-bigger-picture trading pattern, the bullish argument is further bolstered.
• The horizontal resistance that had kept KO stock contained was $46.70, marked with a dashed line on the daily chart. Earnings pushed the stock out of that rut on Tuesday, and the bulls never looked back.
• In the weekly timeframe we can see a long-term trading range has also guided Coca-Cola shares upward since 2013. The upper boundary is just under $50 right now, but could be above $50 by the time it could be tested.
• While the undertow is bullish, don’t be surprised if we see a bit of a pushback this week. Don’t read too much into it either. As long as the $46.70 holds up as a floor, the new uptrend is intact.
Kinder Morgan (KMI)
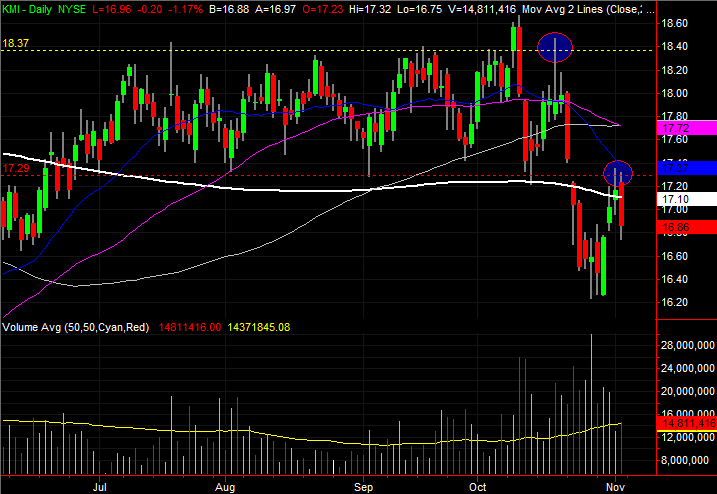
Kinder Morgan has been on the radar for a while, with the most recent look being taken back on Oct. 19 when KMI bumped into a big ceiling at $18.37 and immediately started to peel back. It was a hint that the selling would likely be rekindled, and that the floor at $17.29 would once again be pressured.
That happened. In fact, KMI broke below that floor three days later, and has since confirmed it’s under that former support level in a big, decisive way.
• The best chances at a break back above $17.29 came on Thursday of last week, and then again on Friday. Kinder Morgan couldn’t hurdle it with either effort. It has now become a ceiling.
• Friday’s weakness also dragged KMI back under the 200-day moving average line, plotted in white.
• Though alarming, the breakdown isn’t quite ideal. The bearish gap left behind by the big plunge two weeks ago still hasn’t been filled. It’s still calling the stock higher. Only time will tell if traders care.
Adobe (ADBE)
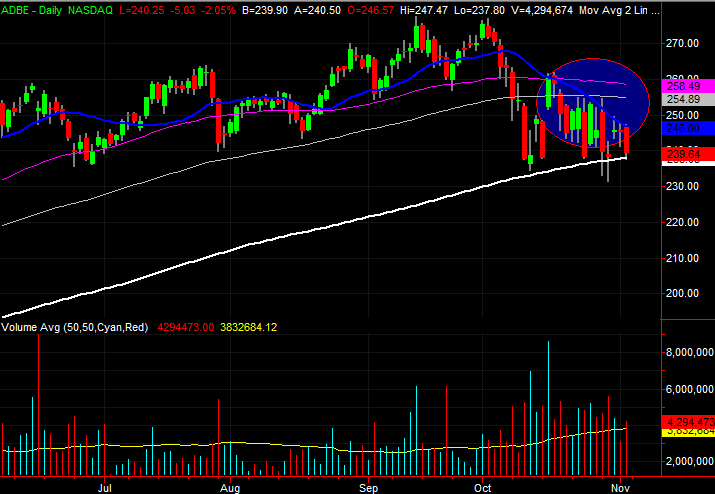
Last but not least, back on Oct. 9 it was pointed out how Adobe shares were testing a key support level … the 200-day moving average line. It has still not been broken, despite several more tests in the meantime. But the battle between the bulls and the bears is about to come to a winner-take-all proposition.

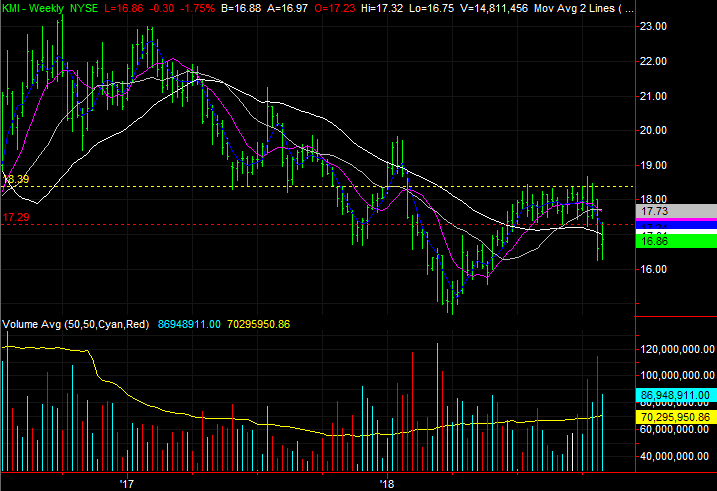
• The 200-day moving average line, plotted in white, was tested as support again on Friday. As the weekly chart shows, this is a test that hasn’t been taken 2016. Failing it now would force investors to rethink the true strength of ADBE.
• The 20-day moving average line, in blue, has started to provide a cap on the stock’s intraday highs, gently but firmly steering it lower into the 200-day average. One or the other has to give soon.
• In the absence of a prior low that will likely serve as a landing point for any pullback, traders will want to keep any eye out for the usual signs of capitulation, should the potential selloff become a reality.
As of this writing, James Brumley did not hold a position in any of the aforementioned securities. You can follow him on Twitter, at @jbrumley.
More From InvestorPlace
The post 3 Big Stock Charts for Monday: Coca-Cola, Kinder Morgan and Adobe appeared first on InvestorPlace.
