With 74% institutional ownership, Truist Financial Corporation (NYSE:TFC) is a favorite amongst the big guns
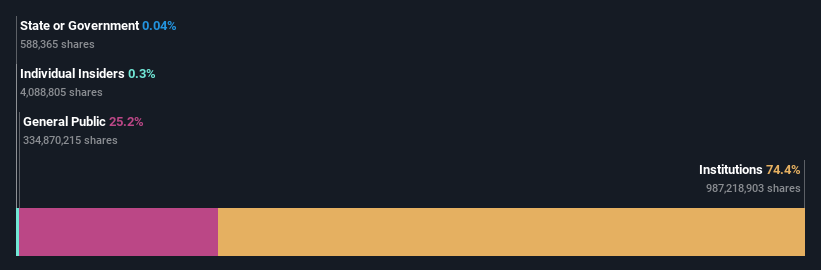
A look at the shareholders of Truist Financial Corporation (NYSE:TFC) can tell us which group is most powerful. The group holding the most number of shares in the company, around 74% to be precise, is institutions. That is, the group stands to benefit the most if the stock rises (or lose the most if there is a downturn).
Since institutional have access to huge amounts of capital, their market moves tend to receive a lot of scrutiny by retail or individual investors. Hence, having a considerable amount of institutional money invested in a company is often regarded as a desirable trait.
Let's delve deeper into each type of owner of Truist Financial, beginning with the chart below.
See our latest analysis for Truist Financial
What Does The Institutional Ownership Tell Us About Truist Financial?
Institutions typically measure themselves against a benchmark when reporting to their own investors, so they often become more enthusiastic about a stock once it's included in a major index. We would expect most companies to have some institutions on the register, especially if they are growing.
We can see that Truist Financial does have institutional investors; and they hold a good portion of the company's stock. This can indicate that the company has a certain degree of credibility in the investment community. However, it is best to be wary of relying on the supposed validation that comes with institutional investors. They too, get it wrong sometimes. If multiple institutions change their view on a stock at the same time, you could see the share price drop fast. It's therefore worth looking at Truist Financial's earnings history below. Of course, the future is what really matters.

Investors should note that institutions actually own more than half the company, so they can collectively wield significant power. Hedge funds don't have many shares in Truist Financial. Our data shows that The Vanguard Group, Inc. is the largest shareholder with 9.1% of shares outstanding. In comparison, the second and third largest shareholders hold about 7.5% and 4.5% of the stock.
A deeper look at our ownership data shows that the top 25 shareholders collectively hold less than half of the register, suggesting a large group of small holders where no single shareholder has a majority.
While it makes sense to study institutional ownership data for a company, it also makes sense to study analyst sentiments to know which way the wind is blowing. There are plenty of analysts covering the stock, so it might be worth seeing what they are forecasting, too.
Insider Ownership Of Truist Financial
While the precise definition of an insider can be subjective, almost everyone considers board members to be insiders. The company management answer to the board and the latter should represent the interests of shareholders. Notably, sometimes top-level managers are on the board themselves.
I generally consider insider ownership to be a good thing. However, on some occasions it makes it more difficult for other shareholders to hold the board accountable for decisions.
Our most recent data indicates that insiders own less than 1% of Truist Financial Corporation. Being so large, we would not expect insiders to own a large proportion of the stock. Collectively, they own US$190m of stock. It is always good to see at least some insider ownership, but it might be worth checking if those insiders have been selling.
General Public Ownership
The general public, who are usually individual investors, hold a 25% stake in Truist Financial. While this group can't necessarily call the shots, it can certainly have a real influence on how the company is run.
Next Steps:
I find it very interesting to look at who exactly owns a company. But to truly gain insight, we need to consider other information, too.
I like to dive deeper into how a company has performed in the past. You can access this interactive graph of past earnings, revenue and cash flow, for free.
If you would prefer discover what analysts are predicting in terms of future growth, do not miss this free report on analyst forecasts.
NB: Figures in this article are calculated using data from the last twelve months, which refer to the 12-month period ending on the last date of the month the financial statement is dated. This may not be consistent with full year annual report figures.
Have feedback on this article? Concerned about the content? Get in touch with us directly. Alternatively, email editorial-team (at) simplywallst.com.
This article by Simply Wall St is general in nature. We provide commentary based on historical data and analyst forecasts only using an unbiased methodology and our articles are not intended to be financial advice. It does not constitute a recommendation to buy or sell any stock, and does not take account of your objectives, or your financial situation. We aim to bring you long-term focused analysis driven by fundamental data. Note that our analysis may not factor in the latest price-sensitive company announcements or qualitative material. Simply Wall St has no position in any stocks mentioned.
Join A Paid User Research Session
You’ll receive a US$30 Amazon Gift card for 1 hour of your time while helping us build better investing tools for the individual investors like yourself. Sign up here
