Should You Like AAON, Inc.’s (NASDAQ:AAON) High Return On Capital Employed?

Today we are going to look at AAON, Inc. (NASDAQ:AAON) to see whether it might be an attractive investment prospect. In particular, we'll consider its Return On Capital Employed (ROCE), as that can give us insight into how profitably the company is able to employ capital in its business.
Firstly, we'll go over how we calculate ROCE. Next, we'll compare it to others in its industry. And finally, we'll look at how its current liabilities are impacting its ROCE.
Return On Capital Employed (ROCE): What is it?
ROCE is a metric for evaluating how much pre-tax income (in percentage terms) a company earns on the capital invested in its business. All else being equal, a better business will have a higher ROCE. Ultimately, it is a useful but imperfect metric. Renowned investment researcher Michael Mauboussin has suggested that a high ROCE can indicate that 'one dollar invested in the company generates value of more than one dollar'.
How Do You Calculate Return On Capital Employed?
The formula for calculating the return on capital employed is:
Return on Capital Employed = Earnings Before Interest and Tax (EBIT) ÷ (Total Assets - Current Liabilities)
Or for AAON:
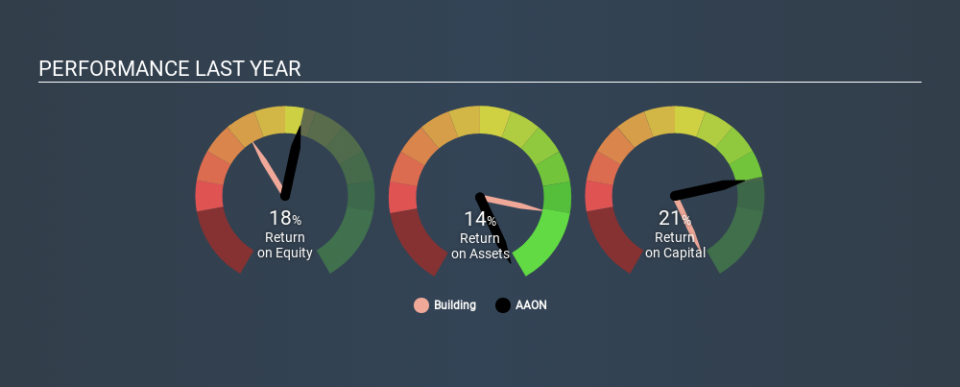
0.21 = US$64m ÷ (US$352m - US$54m) (Based on the trailing twelve months to September 2019.)
Therefore, AAON has an ROCE of 21%.
See our latest analysis for AAON
Does AAON Have A Good ROCE?
One way to assess ROCE is to compare similar companies. AAON's ROCE appears to be substantially greater than the 11% average in the Building industry. We consider this a positive sign, because it suggests it uses capital more efficiently than similar companies. Setting aside the comparison to its industry for a moment, AAON's ROCE in absolute terms currently looks quite high.
AAON's current ROCE of 21% is lower than its ROCE in the past, which was 38%, 3 years ago. Therefore we wonder if the company is facing new headwinds. You can click on the image below to see (in greater detail) how AAON's past growth compares to other companies.
When considering this metric, keep in mind that it is backwards looking, and not necessarily predictive. ROCE can be misleading for companies in cyclical industries, with returns looking impressive during the boom times, but very weak during the busts. This is because ROCE only looks at one year, instead of considering returns across a whole cycle. What happens in the future is pretty important for investors, so we have prepared a free report on analyst forecasts for AAON.
AAON's Current Liabilities And Their Impact On Its ROCE
Current liabilities are short term bills and invoices that need to be paid in 12 months or less. Due to the way ROCE is calculated, a high level of current liabilities makes a company look as though it has less capital employed, and thus can (sometimes unfairly) boost the ROCE. To counter this, investors can check if a company has high current liabilities relative to total assets.
AAON has current liabilities of US$54m and total assets of US$352m. As a result, its current liabilities are equal to approximately 15% of its total assets. This is quite a low level of current liabilities which would not greatly boost the already high ROCE.
What We Can Learn From AAON's ROCE
This is good to see, and with such a high ROCE, AAON may be worth a closer look. AAON looks strong on this analysis, but there are plenty of other companies that could be a good opportunity . Here is a free list of companies growing earnings rapidly.
If you are like me, then you will not want to miss this free list of growing companies that insiders are buying.
If you spot an error that warrants correction, please contact the editor at editorial-team@simplywallst.com. This article by Simply Wall St is general in nature. It does not constitute a recommendation to buy or sell any stock, and does not take account of your objectives, or your financial situation. Simply Wall St has no position in the stocks mentioned.
We aim to bring you long-term focused research analysis driven by fundamental data. Note that our analysis may not factor in the latest price-sensitive company announcements or qualitative material. Thank you for reading.
