What Is Advance NanoTek's (ASX:ANO) P/E Ratio After Its Share Price Rocketed?

Advance NanoTek (ASX:ANO) shareholders are no doubt pleased to see that the share price has bounced 31% in the last month alone, although it is still down 15% over the last quarter. But that gain wasn't enough to make shareholders whole, as the share price is still down 9.3% in the last year.
All else being equal, a sharp share price increase should make a stock less attractive to potential investors. In the long term, share prices tend to follow earnings per share, but in the short term prices bounce around in response to short term factors (which are not always obvious). The implication here is that deep value investors might steer clear when expectations of a company are too high. Perhaps the simplest way to get a read on investors' expectations of a business is to look at its Price to Earnings Ratio (PE Ratio). A high P/E ratio means that investors have a high expectation about future growth, while a low P/E ratio means they have low expectations about future growth.
Check out our latest analysis for Advance NanoTek
How Does Advance NanoTek's P/E Ratio Compare To Its Peers?
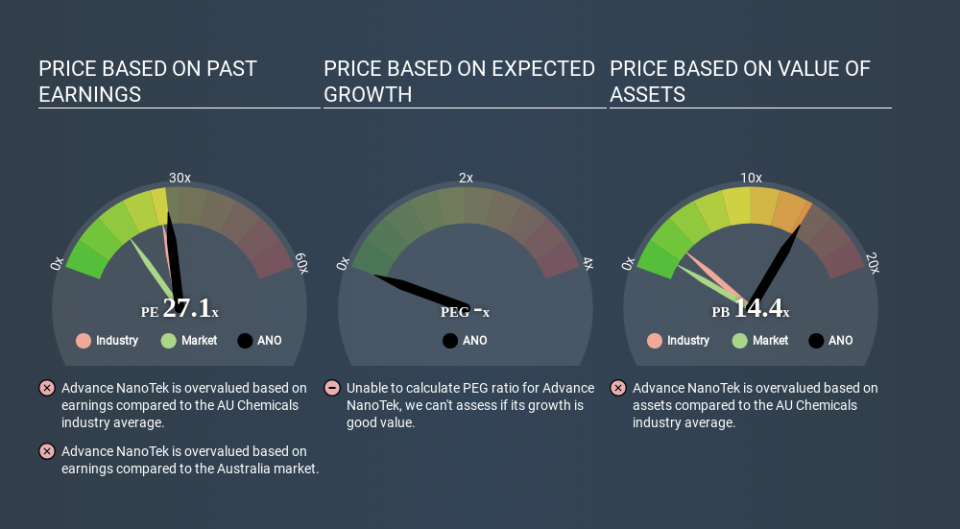
We can tell from its P/E ratio of 27.14 that there is some investor optimism about Advance NanoTek. The image below shows that Advance NanoTek has a higher P/E than the average (25.2) P/E for companies in the chemicals industry.
Its relatively high P/E ratio indicates that Advance NanoTek shareholders think it will perform better than other companies in its industry classification. The market is optimistic about the future, but that doesn't guarantee future growth. So investors should delve deeper. I like to check if company insiders have been buying or selling.
How Growth Rates Impact P/E Ratios
Probably the most important factor in determining what P/E a company trades on is the earnings growth. If earnings are growing quickly, then the 'E' in the equation will increase faster than it would otherwise. That means unless the share price increases, the P/E will reduce in a few years. Then, a lower P/E should attract more buyers, pushing the share price up.
In the last year, Advance NanoTek grew EPS like Taylor Swift grew her fan base back in 2010; the 194% gain was both fast and well deserved. The sweetener is that the annual five year growth rate of 131% is also impressive. With that kind of growth rate we would generally expect a high P/E ratio.
Don't Forget: The P/E Does Not Account For Debt or Bank Deposits
The 'Price' in P/E reflects the market capitalization of the company. In other words, it does not consider any debt or cash that the company may have on the balance sheet. In theory, a company can lower its future P/E ratio by using cash or debt to invest in growth.
Such expenditure might be good or bad, in the long term, but the point here is that the balance sheet is not reflected by this ratio.
So What Does Advance NanoTek's Balance Sheet Tell Us?
Net debt totals just 0.3% of Advance NanoTek's market cap. So it doesn't have as many options as it would with net cash, but its debt would not have much of an impact on its P/E ratio.
The Verdict On Advance NanoTek's P/E Ratio
Advance NanoTek's P/E is 27.1 which is above average (14.9) in its market. While the company does use modest debt, its recent earnings growth is superb. So to be frank we are not surprised it has a high P/E ratio. What we know for sure is that investors have become much more excited about Advance NanoTek recently, since they have pushed its P/E ratio from 20.7 to 27.1 over the last month. For those who prefer to invest with the flow of momentum, that might mean it's time to put the stock on a watchlist, or research it. But the contrarian may see it as a missed opportunity.
When the market is wrong about a stock, it gives savvy investors an opportunity. As value investor Benjamin Graham famously said, 'In the short run, the market is a voting machine but in the long run, it is a weighing machine. Although we don't have analyst forecasts shareholders might want to examine this detailed historical graph of earnings, revenue and cash flow.
Of course, you might find a fantastic investment by looking at a few good candidates. So take a peek at this free list of companies with modest (or no) debt, trading on a P/E below 20.
Love or hate this article? Concerned about the content? Get in touch with us directly. Alternatively, email editorial-team@simplywallst.com.
This article by Simply Wall St is general in nature. It does not constitute a recommendation to buy or sell any stock, and does not take account of your objectives, or your financial situation. We aim to bring you long-term focused analysis driven by fundamental data. Note that our analysis may not factor in the latest price-sensitive company announcements or qualitative material. Simply Wall St has no position in any stocks mentioned. Thank you for reading.
