What is Behind Oasis Midstream Partners LP’s (OMP) Superior ROE?

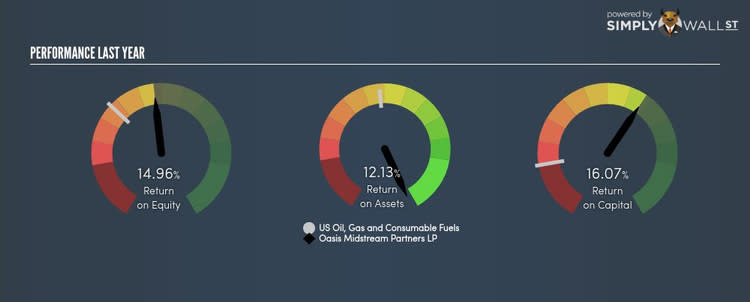
Oasis Midstream Partners LP (NYSE:OMP) outperformed the Oil and Gas Storage and Transportation industry on the basis of its ROE – producing a higher 14.96% relative to the peer average of 8.50% over the past 12 months. Superficially, this looks great since we know that OMP has generated big profits with little equity capital; however, ROE doesn’t tell us how much OMP has borrowed in debt. Today, we’ll take a closer look at some factors like financial leverage to see how sustainable OMP’s ROE is. View our latest analysis for Oasis Midstream Partners
What you must know about ROE
Firstly, Return on Equity, or ROE, is simply the percentage of last years’ earning against the book value of shareholders’ equity. An ROE of 14.96% implies $0.15 returned on every $1 invested. Generally speaking, a higher ROE is preferred; however, there are other factors we must also consider before making any conclusions.
Return on Equity = Net Profit ÷ Shareholders Equity
Returns are usually compared to costs to measure the efficiency of capital. OMP’s cost of equity is 8.68%. Since OMP’s return covers its cost in excess of 6.27%, its use of equity capital is efficient and likely to be sustainable. Simply put, OMP pays less for its capital than what it generates in return. ROE can be broken down into three different ratios: net profit margin, asset turnover, and financial leverage. This is called the Dupont Formula:
Dupont Formula
ROE = profit margin × asset turnover × financial leverage
ROE = (annual net profit ÷ sales) × (sales ÷ assets) × (assets ÷ shareholders’ equity)
ROE = annual net profit ÷ shareholders’ equity
The first component is profit margin, which measures how much of sales is retained after the company pays for all its expenses. Asset turnover shows how much revenue OMP can generate with its current asset base. The most interesting ratio, and reflective of sustainability of its ROE, is financial leverage. Since ROE can be artificially increased through excessive borrowing, we should check OMP’s historic debt-to-equity ratio. Currently the debt-to-equity ratio stands at a low 0.44%, which means its above-average ROE is driven by its ability to grow its profit without a significant debt burden.

What this means for you:
Are you a shareholder? OMP’s ROE is impressive relative to the industry average and also covers its cost of equity. Since its high ROE is not likely driven by high debt, it might be a good time to top up on your current holdings if your fundamental research reaffirms this analysis.
Are you a potential investor? If OMP has been on your watch list for a while, making an investment decision based on ROE alone is unwise. I recommend you do additional fundamental analysis by looking through our most recent infographic report on Oasis Midstream Partners to help you make a more informed investment decision. If you are not interested in OMP anymore, you can use our free platform to see our list of stocks with Return on Equity over 20%.
To help readers see pass the short term volatility of the financial market, we aim to bring you a long-term focused research analysis purely driven by fundamental data. Note that our analysis does not factor in the latest price sensitive company announcements.
The author is an independent contributor and at the time of publication had no position in the stocks mentioned.
