Was BP pl.c.’s (LON:BP.) Earnings Growth Better Than The Industry’s?

Increase in profitability and industry-beating performance can be essential considerations in a stock for some investors. In this article, I will take a look at BP pl.c.’s (LSE:BP.) track record on a high level, to give you some insight into how the company has been performing against its historical trend and its industry peers. View our latest analysis for BP
Commentary On BP.’s Past Performance
I prefer to use data from the most recent 12 months, which either annualizes the most recent 6-month earnings update, or in some cases, the most recent annual report is already the latest available financial data. This technique allows me to examine many different companies on a more comparable basis, using the most relevant data points. For BP, its most recent trailing-twelve-month earnings is US$4.41B, which, against last year’s level, has risen by more than double. Given that these values may be relatively nearsighted, I have determined an annualized five-year figure for BP.’s earnings, which stands at US$8.92B This means that, though earnings increased from last year’s level, over the long run, BP’s earnings have been declining on average.
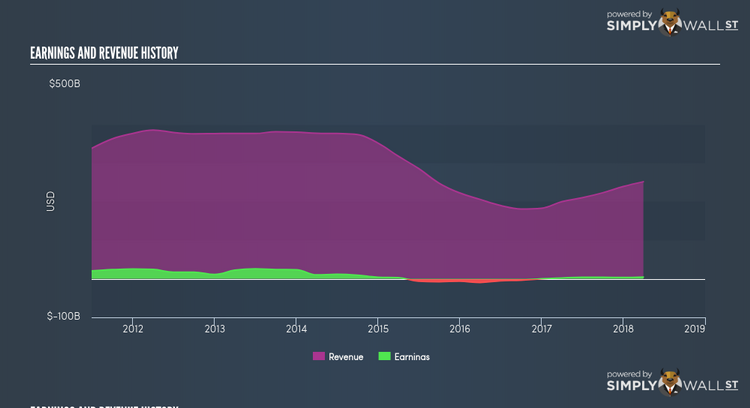
Why is this? Well, let’s look at what’s transpiring with margins and whether the rest of the industry is facing the same headwind. Although revenue growth in the past couple of years, has been negative, earnings growth has been declining by even more, implying that BP has been ramping up its expenses. This harms margins and earnings, and is not a sustainable practice. Inspecting growth from a sector-level, the UK oil and gas industry has been growing its average earnings by double-digit 36.36% in the past year, and a more muted 5.07% over the past five. This suggests that whatever tailwind the industry is deriving benefit from, BP is able to amplify this to its advantage.
What does this mean?
BP’s track record can be a valuable insight into its earnings performance, but it certainly doesn’t tell the whole story. Recent positive growth isn’t always indicative of a continued optimistic outlook. There could be factors that are influencing the entire industry thus the high industry growth rate over the same time period. You should continue to research BP to get a better picture of the stock by looking at:
Future Outlook: What are well-informed industry analysts predicting for BP.’s future growth? Take a look at our free research report of analyst consensus for BP.’s outlook.
Financial Health: Is BP.’s operations financially sustainable? Balance sheets can be hard to analyze, which is why we’ve done it for you. Check out our financial health checks here.
Other High-Performing Stocks: Are there other stocks that provide better prospects with proven track records? Explore our free list of these great stocks here.
NB: Figures in this article are calculated using data from the trailing twelve months from 31 March 2018. This may not be consistent with full year annual report figures.
To help readers see pass the short term volatility of the financial market, we aim to bring you a long-term focused research analysis purely driven by fundamental data. Note that our analysis does not factor in the latest price sensitive company announcements.
The author is an independent contributor and at the time of publication had no position in the stocks mentioned.
