Bruker (NASDAQ:BRKR) sheds 11% this week, as yearly returns fall more in line with earnings growth
While Bruker Corporation (NASDAQ:BRKR) shareholders are probably generally happy, the stock hasn't had particularly good run recently, with the share price falling 13% in the last quarter. But that doesn't change the fact that the returns over the last five years have been respectable. After all, the stock has performed better than the market (68%) in that time, and is up 79%. Unfortunately not all shareholders will have held it for the long term, so spare a thought for those caught in the 36% decline over the last twelve months.
In light of the stock dropping 11% in the past week, we want to investigate the longer term story, and see if fundamentals have been the driver of the company's positive five-year return.
See our latest analysis for Bruker
While the efficient markets hypothesis continues to be taught by some, it has been proven that markets are over-reactive dynamic systems, and investors are not always rational. One imperfect but simple way to consider how the market perception of a company has shifted is to compare the change in the earnings per share (EPS) with the share price movement.
During five years of share price growth, Bruker achieved compound earnings per share (EPS) growth of 13% per year. So the EPS growth rate is rather close to the annualized share price gain of 12% per year. That suggests that the market sentiment around the company hasn't changed much over that time. In fact, the share price seems to largely reflect the EPS growth.
You can see how EPS has changed over time in the image below (click on the chart to see the exact values).
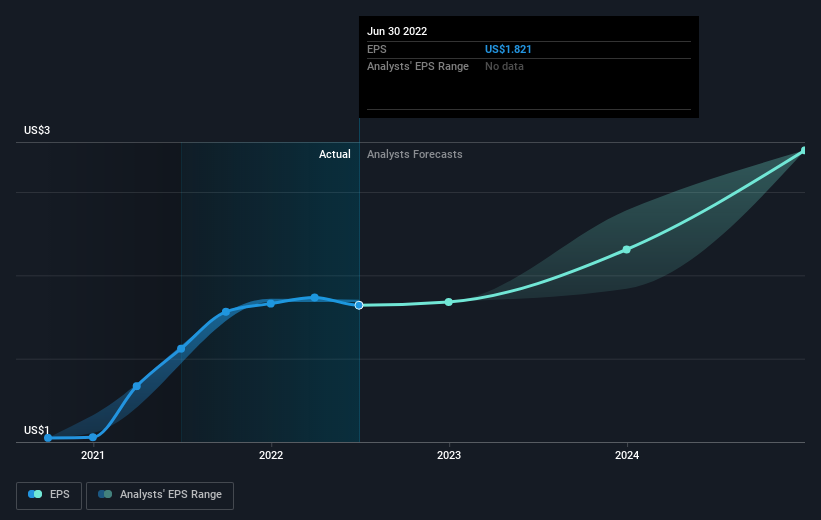
We know that Bruker has improved its bottom line lately, but is it going to grow revenue? If you're interested, you could check this free report showing consensus revenue forecasts.
What About Dividends?
It is important to consider the total shareholder return, as well as the share price return, for any given stock. Whereas the share price return only reflects the change in the share price, the TSR includes the value of dividends (assuming they were reinvested) and the benefit of any discounted capital raising or spin-off. So for companies that pay a generous dividend, the TSR is often a lot higher than the share price return. In the case of Bruker, it has a TSR of 82% for the last 5 years. That exceeds its share price return that we previously mentioned. The dividends paid by the company have thusly boosted the total shareholder return.
A Different Perspective
While the broader market lost about 15% in the twelve months, Bruker shareholders did even worse, losing 36% (even including dividends). Having said that, it's inevitable that some stocks will be oversold in a falling market. The key is to keep your eyes on the fundamental developments. On the bright side, long term shareholders have made money, with a gain of 13% per year over half a decade. If the fundamental data continues to indicate long term sustainable growth, the current sell-off could be an opportunity worth considering. I find it very interesting to look at share price over the long term as a proxy for business performance. But to truly gain insight, we need to consider other information, too. Consider for instance, the ever-present spectre of investment risk. We've identified 1 warning sign with Bruker , and understanding them should be part of your investment process.
For those who like to find winning investments this free list of growing companies with recent insider purchasing, could be just the ticket.
Please note, the market returns quoted in this article reflect the market weighted average returns of stocks that currently trade on US exchanges.
Have feedback on this article? Concerned about the content? Get in touch with us directly. Alternatively, email editorial-team (at) simplywallst.com.
This article by Simply Wall St is general in nature. We provide commentary based on historical data and analyst forecasts only using an unbiased methodology and our articles are not intended to be financial advice. It does not constitute a recommendation to buy or sell any stock, and does not take account of your objectives, or your financial situation. We aim to bring you long-term focused analysis driven by fundamental data. Note that our analysis may not factor in the latest price-sensitive company announcements or qualitative material. Simply Wall St has no position in any stocks mentioned.
Join A Paid User Research Session
You’ll receive a US$30 Amazon Gift card for 1 hour of your time while helping us build better investing tools for the individual investors like yourself. Sign up here
