What CES Energy Solutions' (TSE:CEU) Returns On Capital Can Tell Us

If we're looking to avoid a business that is in decline, what are the trends that can warn us ahead of time? When we see a declining return on capital employed (ROCE) in conjunction with a declining base of capital employed, that's often how a mature business shows signs of aging. Basically the company is earning less on its investments and it is also reducing its total assets. Having said that, after a brief look, CES Energy Solutions (TSE:CEU) we aren't filled with optimism, but let's investigate further.
Understanding Return On Capital Employed (ROCE)
Just to clarify if you're unsure, ROCE is a metric for evaluating how much pre-tax income (in percentage terms) a company earns on the capital invested in its business. Analysts use this formula to calculate it for CES Energy Solutions:
Return on Capital Employed = Earnings Before Interest and Tax (EBIT) ÷ (Total Assets - Current Liabilities)
0.066 = CA$51m ÷ (CA$853m - CA$78m) (Based on the trailing twelve months to June 2020).
So, CES Energy Solutions has an ROCE of 6.6%. In absolute terms, that's a low return and it also under-performs the Energy Services industry average of 11%.
See our latest analysis for CES Energy Solutions
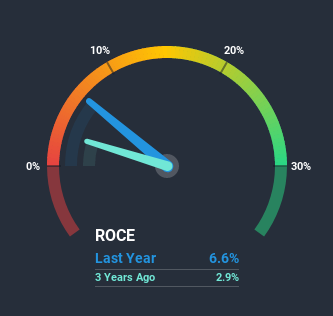
Above you can see how the current ROCE for CES Energy Solutions compares to its prior returns on capital, but there's only so much you can tell from the past. If you'd like, you can check out the forecasts from the analysts covering CES Energy Solutions here for free.
What Can We Tell From CES Energy Solutions' ROCE Trend?
We are a bit worried about the trend of returns on capital at CES Energy Solutions. About five years ago, returns on capital were 9.6%, however they're now substantially lower than that as we saw above. Meanwhile, capital employed in the business has stayed roughly the flat over the period. Companies that exhibit these attributes tend to not be shrinking, but they can be mature and facing pressure on their margins from competition. So because these trends aren't typically conducive to creating a multi-bagger, we wouldn't hold our breath on CES Energy Solutions becoming one if things continue as they have.
The Key Takeaway
In summary, it's unfortunate that CES Energy Solutions is generating lower returns from the same amount of capital. This could explain why the stock has sunk a total of 86% in the last five years. Unless these trends revert to a more positive trajectory, we would look elsewhere.
On a final note, we've found 2 warning signs for CES Energy Solutions that we think you should be aware of.
If you want to search for solid companies with great earnings, check out this free list of companies with good balance sheets and impressive returns on equity.
This article by Simply Wall St is general in nature. It does not constitute a recommendation to buy or sell any stock, and does not take account of your objectives, or your financial situation. We aim to bring you long-term focused analysis driven by fundamental data. Note that our analysis may not factor in the latest price-sensitive company announcements or qualitative material. Simply Wall St has no position in any stocks mentioned.
Have feedback on this article? Concerned about the content? Get in touch with us directly. Alternatively, email editorial-team@simplywallst.com.
