What Can We Make Of Chr. Hansen Holding A/S’s (CPH:CHR) High Return On Capital?

Today we are going to look at Chr. Hansen Holding A/S (CPH:CHR) to see whether it might be an attractive investment prospect. In particular, we'll consider its Return On Capital Employed (ROCE), as that can give us insight into how profitably the company is able to employ capital in its business.
First up, we'll look at what ROCE is and how we calculate it. Next, we'll compare it to others in its industry. Then we'll determine how its current liabilities are affecting its ROCE.
Understanding Return On Capital Employed (ROCE)
ROCE measures the amount of pre-tax profits a company can generate from the capital employed in its business. All else being equal, a better business will have a higher ROCE. Overall, it is a valuable metric that has its flaws. Renowned investment researcher Michael Mauboussin has suggested that a high ROCE can indicate that 'one dollar invested in the company generates value of more than one dollar'.
How Do You Calculate Return On Capital Employed?
Analysts use this formula to calculate return on capital employed:
Return on Capital Employed = Earnings Before Interest and Tax (EBIT) ÷ (Total Assets - Current Liabilities)
Or for Chr. Hansen Holding:
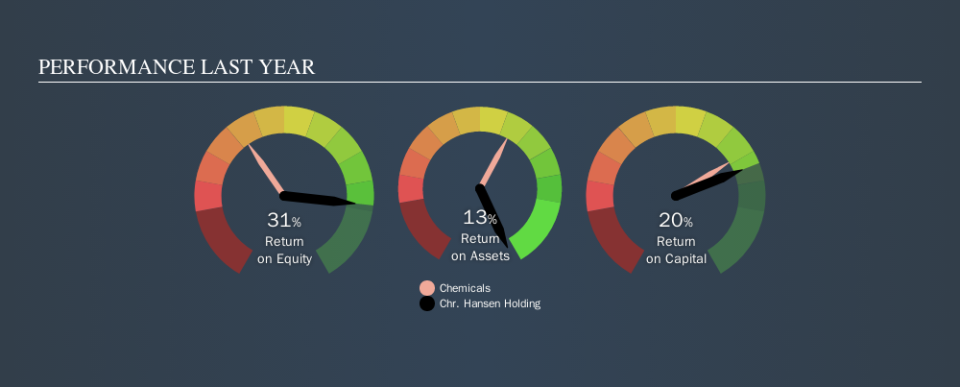
0.20 = €343m ÷ (€2.1b - €361m) (Based on the trailing twelve months to August 2019.)
Therefore, Chr. Hansen Holding has an ROCE of 20%.
See our latest analysis for Chr. Hansen Holding
Does Chr. Hansen Holding Have A Good ROCE?
ROCE is commonly used for comparing the performance of similar businesses. Chr. Hansen Holding's ROCE appears to be substantially greater than the 8.8% average in the Chemicals industry. I think that's good to see, since it implies the company is better than other companies at making the most of its capital. Putting aside its position relative to its industry for now, in absolute terms, Chr. Hansen Holding's ROCE is currently very good.
You can click on the image below to see (in greater detail) how Chr. Hansen Holding's past growth compares to other companies.
Remember that this metric is backwards looking - it shows what has happened in the past, and does not accurately predict the future. Companies in cyclical industries can be difficult to understand using ROCE, as returns typically look high during boom times, and low during busts. ROCE is, after all, simply a snap shot of a single year. Future performance is what matters, and you can see analyst predictions in our free report on analyst forecasts for the company.
How Chr. Hansen Holding's Current Liabilities Impact Its ROCE
Liabilities, such as supplier bills and bank overdrafts, are referred to as current liabilities if they need to be paid within 12 months. Due to the way the ROCE equation works, having large bills due in the near term can make it look as though a company has less capital employed, and thus a higher ROCE than usual. To check the impact of this, we calculate if a company has high current liabilities relative to its total assets.
Chr. Hansen Holding has total assets of €2.1b and current liabilities of €361m. As a result, its current liabilities are equal to approximately 18% of its total assets. The fairly low level of current liabilities won't have much impact on the already great ROCE.
The Bottom Line On Chr. Hansen Holding's ROCE
Low current liabilities and high ROCE is a good combination, making Chr. Hansen Holding look quite interesting. Chr. Hansen Holding shapes up well under this analysis, but it is far from the only business delivering excellent numbers . You might also want to check this free collection of companies delivering excellent earnings growth.
For those who like to find winning investments this free list of growing companies with recent insider purchasing, could be just the ticket.
We aim to bring you long-term focused research analysis driven by fundamental data. Note that our analysis may not factor in the latest price-sensitive company announcements or qualitative material.
If you spot an error that warrants correction, please contact the editor at editorial-team@simplywallst.com. This article by Simply Wall St is general in nature. It does not constitute a recommendation to buy or sell any stock, and does not take account of your objectives, or your financial situation. Simply Wall St has no position in the stocks mentioned. Thank you for reading.
