Is Consolidated-Tomoka Land Co.’s (NYSEMKT:CTO) P/E Ratio Really That Good?

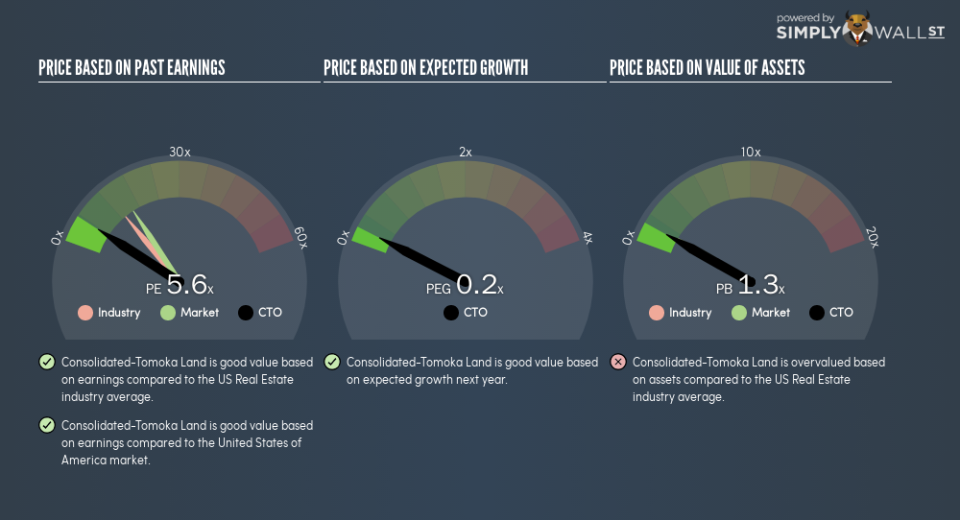
The goal of this article is to teach you how to use price to earnings ratios (P/E ratios). We’ll show how you can use Consolidated-Tomoka Land Co.’s (NYSEMKT:CTO) P/E ratio to inform your assessment of the investment opportunity. Based on the last twelve months, Consolidated-Tomoka Land’s P/E ratio is 5.56. In other words, at today’s prices, investors are paying $5.56 for every $1 in prior year profit.
See our latest analysis for Consolidated-Tomoka Land
How Do You Calculate A P/E Ratio?
The formula for P/E is:
Price to Earnings Ratio = Share Price ÷ Earnings per Share (EPS)
Or for Consolidated-Tomoka Land:
P/E of 5.56 = $50.08 ÷ $9.01 (Based on the year to September 2018.)
Is A High Price-to-Earnings Ratio Good?
A higher P/E ratio implies that investors pay a higher price for the earning power of the business. That isn’t necessarily good or bad, but a high P/E implies relatively high expectations of what a company can achieve in the future.
How Growth Rates Impact P/E Ratios
P/E ratios primarily reflect market expectations around earnings growth rates. Earnings growth means that in the future the ‘E’ will be higher. That means even if the current P/E is high, it will reduce over time if the share price stays flat. Then, a lower P/E should attract more buyers, pushing the share price up.
Consolidated-Tomoka Land increased earnings per share by a whopping 123% last year. And it has bolstered its earnings per share by 56% per year over the last five years. With that performance, I would expect it to have an above average P/E ratio.
How Does Consolidated-Tomoka Land’s P/E Ratio Compare To Its Peers?
We can get an indication of market expectations by looking at the P/E ratio. If you look at the image below, you can see Consolidated-Tomoka Land has a lower P/E than the average (13.1) in the real estate industry classification.
This suggests that market participants think Consolidated-Tomoka Land will underperform other companies in its industry. Since the market seems unimpressed with Consolidated-Tomoka Land, it’s quite possible it could surprise on the upside. It is arguably worth checking if insiders are buying shares, because that might imply they believe the stock is undervalued.
Don’t Forget: The P/E Does Not Account For Debt or Bank Deposits
Don’t forget that the P/E ratio considers market capitalization. That means it doesn’t take debt or cash into account. Hypothetically, a company could reduce its future P/E ratio by spending its cash (or taking on debt) to achieve higher earnings.
Such spending might be good or bad, overall, but the key point here is that you need to look at debt to understand the P/E ratio in context.
How Does Consolidated-Tomoka Land’s Debt Impact Its P/E Ratio?
Consolidated-Tomoka Land has net debt worth 62% of its market capitalization. This is enough debt that you’d have to make some adjustments before using the P/E ratio to compare it to a company with net cash.
The Bottom Line On Consolidated-Tomoka Land’s P/E Ratio
Consolidated-Tomoka Land has a P/E of 5.6. That’s below the average in the US market, which is 15.8. While the EPS growth last year was strong, the significant debt levels reduce the number of options available to management. If the company can continue to grow earnings, then the current P/E may be unjustifiably low.
Investors should be looking to buy stocks that the market is wrong about. If it is underestimating a company, investors can make money by buying and holding the shares until the market corrects itself. So this free report on the analyst consensus forecasts could help you make a master move on this stock.
Of course you might be able to find a better stock than Consolidated-Tomoka Land. So you may wish to see this free collection of other companies that have grown earnings strongly.
To help readers see past the short term volatility of the financial market, we aim to bring you a long-term focused research analysis purely driven by fundamental data. Note that our analysis does not factor in the latest price-sensitive company announcements.
The author is an independent contributor and at the time of publication had no position in the stocks mentioned. For errors that warrant correction please contact the editor at editorial-team@simplywallst.com.
