Continental Resources, Inc. (NYSE:CLR) Earns Among The Best Returns In Its Industry

Want to participate in a short research study? Help shape the future of investing tools and you could win a $250 gift card!
Today we are going to look at Continental Resources, Inc. (NYSE:CLR) to see whether it might be an attractive investment prospect. Specifically, we’ll consider its Return On Capital Employed (ROCE), since that will give us an insight into how efficiently the business can generate profits from the capital it requires.
First of all, we’ll work out how to calculate ROCE. Next, we’ll compare it to others in its industry. Finally, we’ll look at how its current liabilities affect its ROCE.
Understanding Return On Capital Employed (ROCE)
ROCE measures the amount of pre-tax profits a company can generate from the capital employed in its business. Generally speaking a higher ROCE is better. Overall, it is a valuable metric that has its flaws. Author Edwin Whiting says to be careful when comparing the ROCE of different businesses, since ‘No two businesses are exactly alike.’
How Do You Calculate Return On Capital Employed?
Analysts use this formula to calculate return on capital employed:
Return on Capital Employed = Earnings Before Interest and Tax (EBIT) ÷ (Total Assets – Current Liabilities)
Or for Continental Resources:
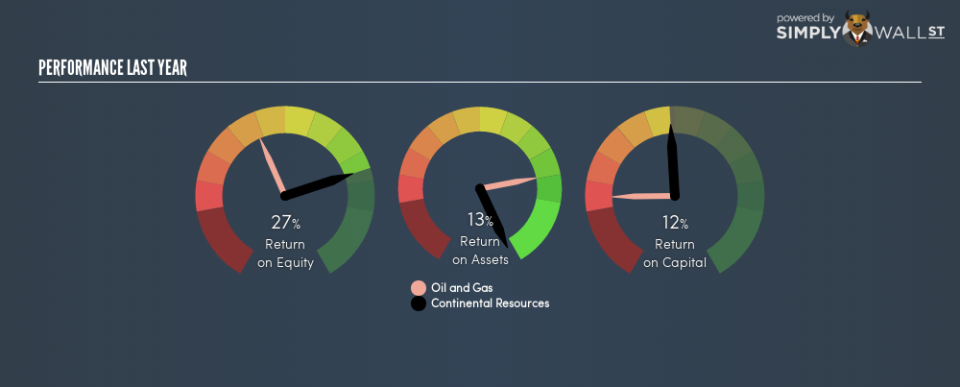
0.12 = US$454m ÷ (US$15b – US$1.5b) (Based on the trailing twelve months to September 2018.)
Therefore, Continental Resources has an ROCE of 12%.
View our latest analysis for Continental Resources
Is Continental Resources’s ROCE Good?
One way to assess ROCE is to compare similar companies. In our analysis, Continental Resources’s ROCE is meaningfully higher than the 6.2% average in the Oil and Gas industry. I think that’s good to see, since it implies the company is better than other companies at making the most of its capital. Independently of how Continental Resources compares to its industry, its ROCE in absolute terms appears decent, and the company may be worthy of closer investigation.
Our data shows that Continental Resources currently has an ROCE of 12%, compared to its ROCE of 1.1% 3 years ago. This makes us think about whether the company has been reinvesting shrewdly.
Remember that this metric is backwards looking – it shows what has happened in the past, and does not accurately predict the future. Companies in cyclical industries can be difficult to understand using ROCE, as returns typically look high during boom times, and low during busts. ROCE is, after all, simply a snap shot of a single year. Remember that most companies like Continental Resources are cyclical businesses. Future performance is what matters, and you can see analyst predictions in our free report on analyst forecasts for the company.
Continental Resources’s Current Liabilities And Their Impact On Its ROCE
Short term (or current) liabilities, are things like supplier invoices, overdrafts, or tax bills that need to be paid within 12 months. Due to the way the ROCE equation works, having large bills due in the near term can make it look as though a company has less capital employed, and thus a higher ROCE than usual. To check the impact of this, we calculate if a company has high current liabilities relative to its total assets.
Continental Resources has total liabilities of US$1.5b and total assets of US$15b. As a result, its current liabilities are equal to approximately 9.9% of its total assets. Low current liabilities have only a minimal impact on Continental Resources’s ROCE, making its decent returns more credible.
What We Can Learn From Continental Resources’s ROCE
This is good to see, and while better prospects may exist, Continental Resources seems worth researching further. Of course, you might find a fantastic investment by looking at a few good candidates. So take a peek at this free list of companies with modest (or no) debt, trading on a P/E below 20.
If you like to buy stocks alongside management, then you might just love this free list of companies. (Hint: insiders have been buying them).
To help readers see past the short term volatility of the financial market, we aim to bring you a long-term focused research analysis purely driven by fundamental data. Note that our analysis does not factor in the latest price-sensitive company announcements.
The author is an independent contributor and at the time of publication had no position in the stocks mentioned. For errors that warrant correction please contact the editor at editorial-team@simplywallst.com.
