Could The Cambridge Bancorp (NASDAQ:CATC) Ownership Structure Tell Us Something Useful?
If you want to know who really controls Cambridge Bancorp (NASDAQ:CATC), then you'll have to look at the makeup of its share registry. Institutions often own shares in more established companies, while it's not unusual to see insiders own a fair bit of smaller companies. Companies that have been privatized tend to have low insider ownership.
With a market capitalization of US$589m, Cambridge Bancorp is a small cap stock, so it might not be well known by many institutional investors. Our analysis of the ownership of the company, below, shows that institutions are noticeable on the share registry. We can zoom in on the different ownership groups, to learn more about Cambridge Bancorp.
Check out our latest analysis for Cambridge Bancorp
What Does The Institutional Ownership Tell Us About Cambridge Bancorp?
Many institutions measure their performance against an index that approximates the local market. So they usually pay more attention to companies that are included in major indices.
We can see that Cambridge Bancorp does have institutional investors; and they hold a good portion of the company's stock. This can indicate that the company has a certain degree of credibility in the investment community. However, it is best to be wary of relying on the supposed validation that comes with institutional investors. They too, get it wrong sometimes. It is not uncommon to see a big share price drop if two large institutional investors try to sell out of a stock at the same time. So it is worth checking the past earnings trajectory of Cambridge Bancorp, (below). Of course, keep in mind that there are other factors to consider, too.

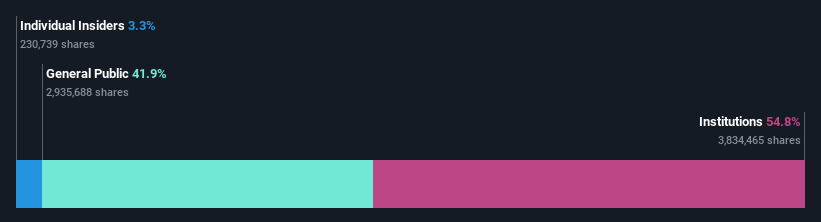
Institutional investors own over 50% of the company, so together than can probably strongly influence board decisions. We note that hedge funds don't have a meaningful investment in Cambridge Bancorp. BlackRock, Inc. is currently the largest shareholder, with 6.2% of shares outstanding. For context, the second largest shareholder holds about 5.1% of the shares outstanding, followed by an ownership of 4.7% by the third-largest shareholder. Furthermore, CEO Denis Sheahan is the owner of 0.6% of the company's shares.
A deeper look at our ownership data shows that the top 25 shareholders collectively hold less than half of the register, suggesting a large group of small holders where no single shareholder has a majority.
While studying institutional ownership for a company can add value to your research, it is also a good practice to research analyst recommendations to get a deeper understand of a stock's expected performance. Quite a few analysts cover the stock, so you could look into forecast growth quite easily.
Insider Ownership Of Cambridge Bancorp
The definition of an insider can differ slightly between different countries, but members of the board of directors always count. Management ultimately answers to the board. However, it is not uncommon for managers to be executive board members, especially if they are a founder or the CEO.
I generally consider insider ownership to be a good thing. However, on some occasions it makes it more difficult for other shareholders to hold the board accountable for decisions.
We can see that insiders own shares in Cambridge Bancorp. It has a market capitalization of just US$589m, and insiders have US$19m worth of shares, in their own names. It is good to see some investment by insiders, but it might be worth checking if those insiders have been buying.
General Public Ownership
The general public, who are usually individual investors, hold a 42% stake in Cambridge Bancorp. While this group can't necessarily call the shots, it can certainly have a real influence on how the company is run.
Next Steps:
While it is well worth considering the different groups that own a company, there are other factors that are even more important.
I like to dive deeper into how a company has performed in the past. You can find historic revenue and earnings in this detailed graph.
But ultimately it is the future, not the past, that will determine how well the owners of this business will do. Therefore we think it advisable to take a look at this free report showing whether analysts are predicting a brighter future.
NB: Figures in this article are calculated using data from the last twelve months, which refer to the 12-month period ending on the last date of the month the financial statement is dated. This may not be consistent with full year annual report figures.
Have feedback on this article? Concerned about the content? Get in touch with us directly. Alternatively, email editorial-team (at) simplywallst.com.
This article by Simply Wall St is general in nature. We provide commentary based on historical data and analyst forecasts only using an unbiased methodology and our articles are not intended to be financial advice. It does not constitute a recommendation to buy or sell any stock, and does not take account of your objectives, or your financial situation. We aim to bring you long-term focused analysis driven by fundamental data. Note that our analysis may not factor in the latest price-sensitive company announcements or qualitative material. Simply Wall St has no position in any stocks mentioned.
