Cross-Sector: Market Data Highlights

CROSS-SECTOR
DATA REPORT
22 April 2021
CLIENT SERVICES
Americas
1-212-553-1653
Asia Pacific
852-3551-3077
Japan
81-3-5408-4100
EMEA
44-20-7772-5454
Cross-Sector
Market Data Highlights
The latest market data from Weekly Market Outlook. Click
for access to the full WMO.
SPREADS
0
200
400
600
800
0
200
400
600
800
2003 2004 2005 2006 2007 2008 2009 2010 2011 2012 2013 2014 2015 2016 2017 2018 2019 2020 2021
Spread (bp)
Spread (bp)
Aa2
A2
Baa2
Source: Moody's
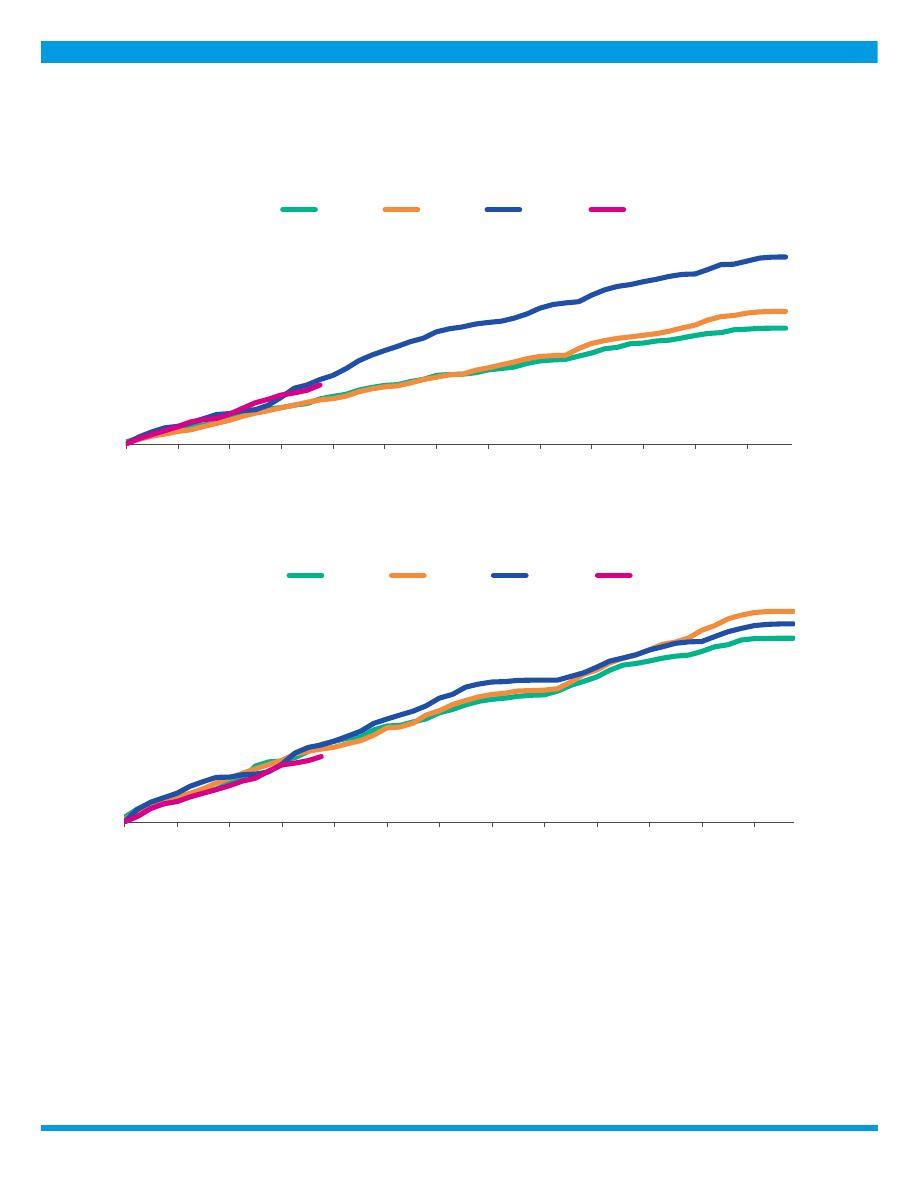
Figure 1: 5-Year Median Spreads-Global Data (High Grade)
0
400
800
1,200
1,600
2,000
0
400
800
1,200
1,600
2,000
2003 2004 2005 2006 2007 2008 2009 2010 2011 2012 2013 2014 2015 2016 2017 2018 2019 2020 2021
Spread (bp)
Spread (bp)
Ba2
B2
Caa-C
Source: Moody's
Figure 2: 5-Year Median Spreads-Global Data (High Yield)
Moody’s Analytics markets and distributes all Moody’s Capital Markets Research, Inc. materials. Moody’s Capital Markets
Research,Inc. is a subsidiary of Moody’s Corporation. Moody’s Analytics does not provide investment advisory services or
products. For further detail, please see the last page.

MOODY'S ANALYTICS
CROSS-SECTOR
CDS MOVERS
CDS Implied Rating Rises
Issuer
Apr. 21
Apr. 14
Senior Ratings
PPG Industries, Inc.
A3
Baa2
A3
Raytheon Technologies Corporation
A2
A3
Baa1
Philip Morris International Inc.
A1
A2
A2
Bank of New York Mellon Corporation (The)
A1
A2
A1
PNC Financial Services Group, Inc.
A2
A3
A3
Dish DBS Corporation
Caa1
Caa2
B2
ERP Operating Limited Partnership
A2
A3
A3
WEC Energy Group, Inc.
A3
Baa1
Baa1
Liberty Interactive LLC
B3
Caa1
B2
iStar Inc.
B1
B2
Ba3
CDS Implied Rating Declines
Issuer
Apr. 21
Apr. 14
Senior Ratings
Altria Group Inc.
Baa2
A3
A3
JPMorgan Chase & Co.
A3
A2
A2
Bank of America Corporation
A3
A2
A2
Ally Financial Inc.
Ba1
Baa3
Ba1
Apple Inc.
A1
Aa3
Aa1
Comcast Corporation
A3
A2
A3
Oracle Corporation
A2
A1
Baa2
American Express Credit Corporation
A3
A2
A2
CVS Health Corporation
Baa1
A3
Baa2
Amazon.com, Inc.
A2
A1
A2
CDS Spread Increases
Issuer
Senior Ratings
Apr. 21
Apr. 14
Spread Diff
Carnival Corporation
B2
348
315
33
Royal Caribbean Cruises Ltd.
B2
382
352
30
Encompass Health Corp.
B1
178
161
17
Univision Communications Inc.
Caa2
320
304
16
Murphy Oil Corporation
Ba3
428
412
16
American Airlines Group Inc.
Caa1
787
771
16
Altria Group Inc.
A3
59
45
14
Walgreen Co.
Baa2
65
51
14
Pactiv Corporation
Caa1
411
396
14
Nordstrom, Inc.
Baa3
253
240
13
CDS Spread Decreases
Issuer
Senior Ratings
Apr. 21
Apr. 14
Spread Diff
R.R. Donnelley & Sons Company
B3
463
511
-48
Staples, Inc.
B3
692
734
-41
Dish DBS Corporation
B2
367
393
-26
iStar Inc.
Ba3
277
304
-26
Dell Inc.
Ba2
86
108
-22
Talen Energy Supply, LLC
B3
1,127
1,147
-20
Levi Strauss & Co.
Ba2
123
142
-19
Marathon Oil Corporation
Baa3
157
169
-12
Cameron International Corporation
Baa1
85
97
-12
United Airlines, Inc.
Ba3
416
427
-11
Source: Moody's, CMA
CDS Spreads
CDS Implied Ratings
CDS Implied Ratings
CDS Spreads
Figure 3. CDS Movers - US ( April 14, 2021 April 21, 2021)
2 22 April 2021
Cross-Sector: Market Data Highlights
MOODY'S ANALYTICS
CROSS-SECTOR
CDS Implied Rating Rises
Issuer
Apr. 21
Apr. 14
Senior Ratings
Rabobank
Aa2
Aa3
Aa3
Barclays PLC
Baa1
Baa2
Baa2
Portugal , Government of
Aa3
A1
Baa3
Commerzbank AG
A3
Baa1
A1
NatWest Group plc
Baa1
Baa2
Baa2
NatWest Markets Plc
A3
Baa1
A3
FCE Bank plc
Ba2
Ba3
Ba2
Credit Suisse AG
Baa1
Baa2
Aa3
BAWAG P.S.K. AG
Baa2
Baa3
A2
Bertelsmann SE & Co. KGaA
Aa3
A1
Baa2
CDS Implied Rating Declines
Issuer
Apr. 21
Apr. 14
Senior Ratings
Schaeffler Finance B.V.
Baa1
A2
Ba2
Banca Monte dei Paschi di Siena S.p.A .
Ba3
Ba2
Caa1
Merck KGaA
Aa2
Aa1
Baa1
United Utilities PLC
A2
A1
Baa1
Henkel AG & Co. KGaA
Aa2
Aa1
A2
Caixa Geral de Depositos, S.A.
Ba1
Baa3
Ba1
thyssenkrupp AG
B1
Ba3
B1
Italy , Government of
Baa3
Baa3
Baa3
France , Government of
Aa2
Aa2
Aa2
United Kingdom , Government of
Aaa
Aaa
Aa3
CDS Spread Increases
Issuer
Senior Ratings
Apr. 21
Apr. 14
Spread Diff
Novafives S.A.S.
Caa2
769
743
26
Iceland Bondco plc
Caa2
420
397
23
thyssenkrupp AG
B1
243
227
17
Deutsche Lufthansa Aktiengesellschaft
Ba2
284
270
14
Piraeus Financial Holdings S.A.
Caa3
521
506
14
Casino Guichard-Perrachon SA
Caa1
524
511
13
Rolls-Royce plc
Ba3
269
259
10
Schaeffler Finance B.V.
Ba2
53
43
9
CMA CGM S.A.
B3
403
395
8
Ziggo Bond Company B.V.
B3
236
228
8
CDS Spread Decreases
Issuer
Senior Ratings
Apr. 21
Apr. 14
Spread Diff
FCE Bank plc
Ba2
152
194
-43
Stena AB
Caa1
557
569
-12
GKN Holdings Limited
Ba1
137
147
-10
Hammerson Plc
Baa3
233
240
-8
Stagecoach Group Plc
Baa3
77
85
-8
Unibail-Rodamco-Westfield SE
Baa2
110
117
-7
BAWAG P.S.K. AG
A2
63
70
-6
Smiths Group plc
Baa2
71
77
-6
Schneider Electric SE
A3
26
31
-5
VERBUND AG
A3
33
38
-5
Source: Moody's, CMA
CDS Spreads
CDS Implied Ratings
CDS Implied Ratings
CDS Spreads
Figure 4. CDS Movers - Europe ( April 14, 2021 April 21, 2021)
3 22 April 2021
Cross-Sector: Market Data Highlights
MOODY'S ANALYTICS
CROSS-SECTOR
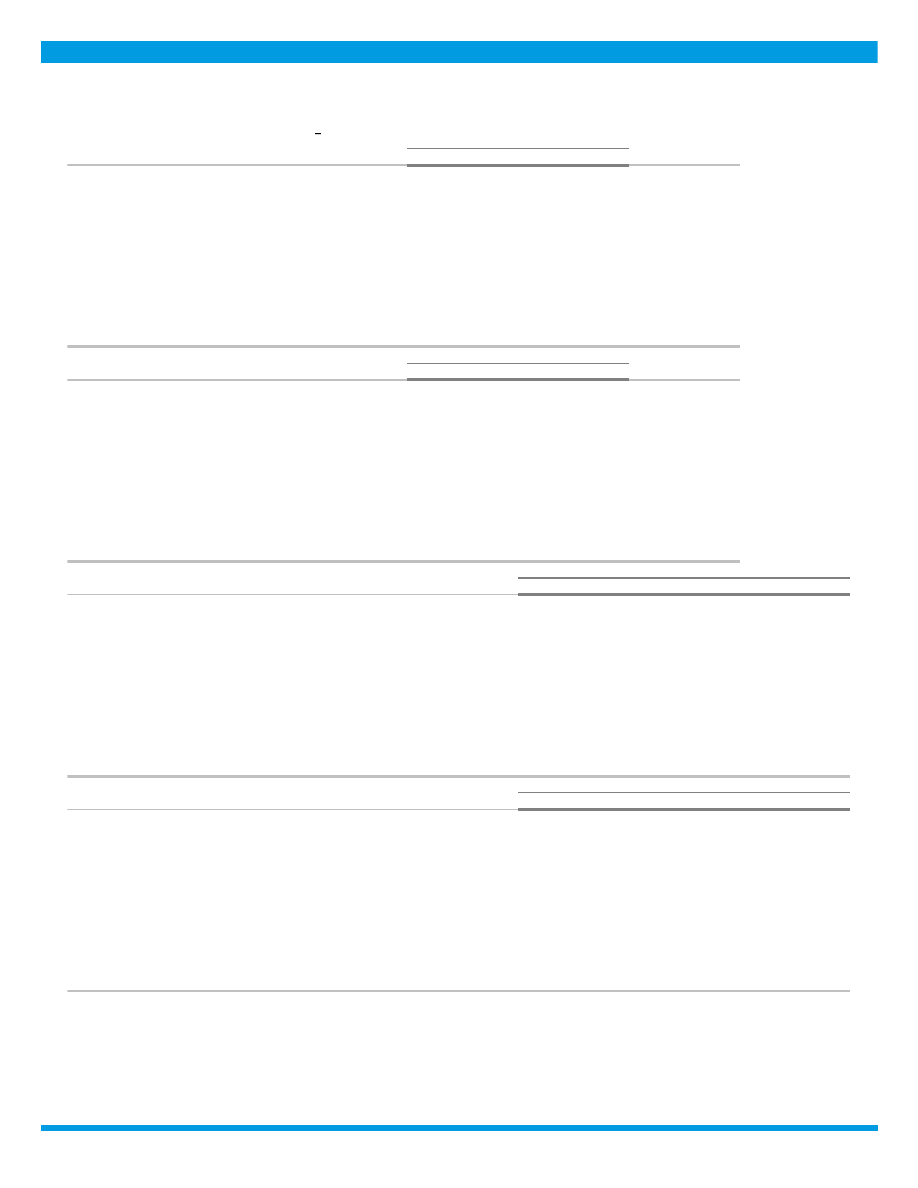
ISSUANCE
0
700
1,400
2,100
2,800
0
700
1,400
2,100
2,800
Jan
Feb
Mar
Apr
May
Jun
Jul
Aug
Sep
Oct
Nov
Dec
Issuance ($B)
Issuance ($B)
2018
2019
2020
2021
Source:
Moody's / Dealogic
Figure 5. Market Cumulative Issuance - Corporate & Financial Institutions: USD Denominated
0
200
400
600
800
1,000
0
200
400
600
800
1,000
Jan
Feb
Mar
Apr
May
Jun
Jul
Aug
Sep
Oct
Nov
Dec
Issuance ($B)
Issuance ($B)
2018
2019
2020
2021
Source:
Moody's / Dealogic
Figure 6. Market Cumulative Issuance - Corporate & Financial Institutions: Euro Denominated
4 22 April 2021
Cross-Sector: Market Data Highlights

MOODY'S ANALYTICS
CROSS-SECTOR
Investment-Grade
High-Yield
Total*
Amount
Amount
Amount
$B
$B
$B
Weekly
57.100
18.440
77.370
Year-to-Date
574.652
241.945
836.371
Investment-Grade
High-Yield
Total*
Amount
Amount
Amount
$B
$B
$B
Weekly
10.789
7.414
18.364
Year-to-Date
239.495
52.728
302.090
* Difference represents issuance with pending ratings.
Source: Moody's/ Dealogic
USD Denominated
Euro Denominated
Figure 7. Issuance: Corporate & Financial Institutions
EMERGING MARKET CREDIT SPREADS
Emerging Market
Duration
A
Baa
Ba
B
A
Baa
Ba
B
>=1 and <3
62
110
270
437
66
133
53
45
>=3 and <5
86
126
292
500
72
118
59
52
>=5 and <7
96
161
315
537
46
93
27
21
>=7
118
209
368
563
125
218
57
40
Emerging Market Sovereign
Duration
A
Baa
Ba
B
A
Baa
Ba
B
>=1 and <3
38
61
83
429
15
32
15
19
>=3 and <5
44
91
205
486
18
35
24
30
>=5 and <7
76
122
265
539
18
33
19
20
>=7
71
191
336
563
82
115
46
39
Emerging Market Corporate
Duration
A
Baa
Ba
B
A
Baa
Ba
B
>=1 and <3
67
122
297
477
51
101
38
26
>=3 and <5
91
156
347
566
54
83
35
22
>=5 and <7
115
195
373
277
28
60
8
1
>=7
143
227
543
636
43
103
11
1
Source: Moody's
Median Spreads
Bond Counts
Median Spreads
Bond Counts
Figure 8. Emerging Market Median OAS
Bond Counts
Median Spreads
5 22 April 2021
Cross-Sector: Market Data Highlights
MOODY'S ANALYTICS
CROSS-SECTOR
0
600
1,200
1,800
2,400
0
600
1,200
1,800
2,400
2003 2004 2005 2006 2007 2008 2009 2010 2011 2012 2013 2014 2015 2016 2017 2018 2019 2020 2021
Spread (bp)
Spread (bp)
A
Baa
Ba
B
Source: Moody's
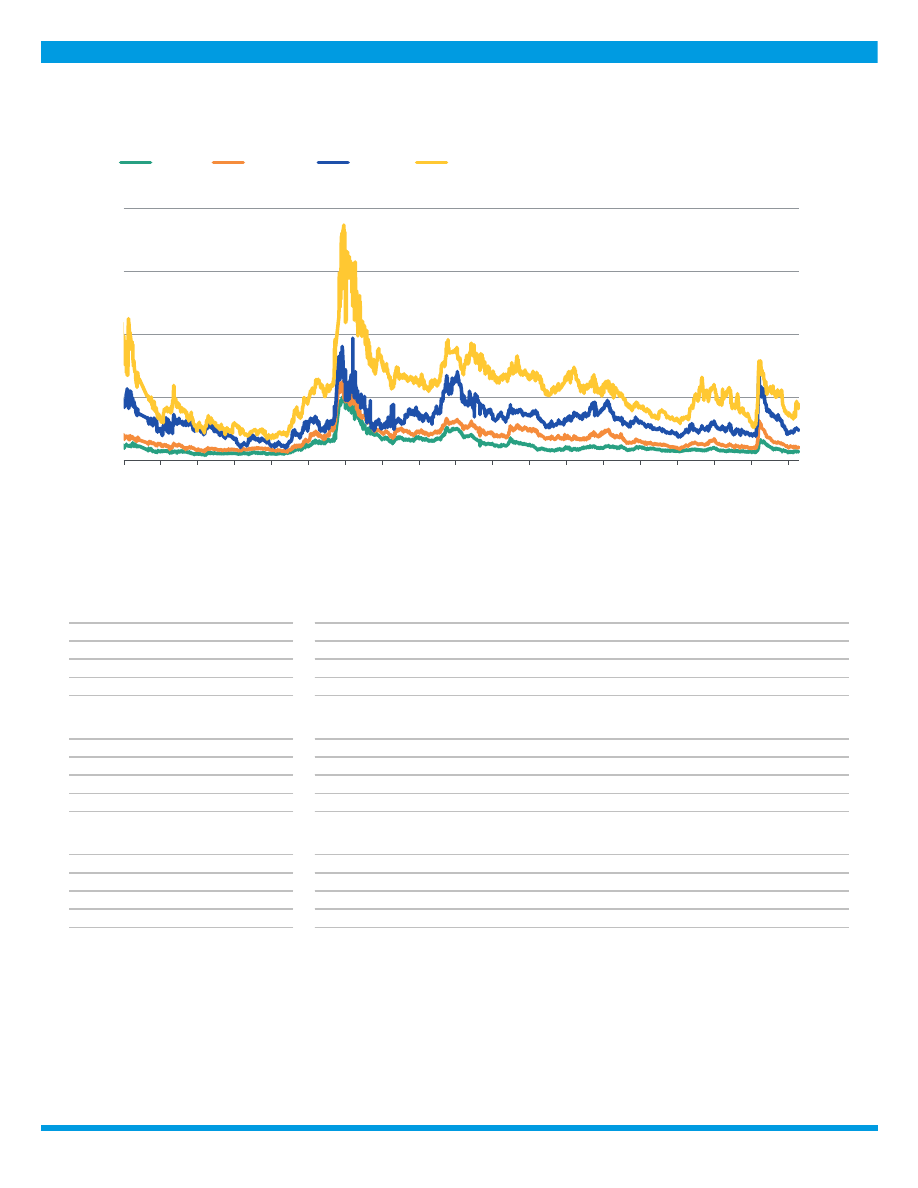
Figure 9: Emerging Markets Median Credit Spreads (3-5 year duration)
MEDIAN CREDIT SPREADS
Duration
Aaa
Aa
A
Baa
Ba
B
Caa
>=1 and <3
10
25
41
72
206
450
567
>=3 and <5
8
32
55
104
259
566
502
>=5 and <7
21
29
67
137
291
344
-
>=7
26
39
80
160
232
397
393
Duration
Aaa
Aa
A
Baa
Ba
B
Caa
>=1 and <3
191
277
446
284
71
24
5
>=3 and <5
201
209
368
290
66
18
2
>=5 and <7
107
137
213
146
19
3
-
>=7
128
315
558
265
16
1
2
Duration
Aaa
Aa
A
Baa
Ba
B
Caa
>=1 and <3
26
85
175
159
45
23
5
>=3 and <5
30
80
152
157
42
17
2
>=5 and <7
27
62
98
90
15
3
-
>=7
31
88
153
115
12
1
1
Source: Moody's
Figure 10. Global Financial Institutions Median Credit Spreads
Median Spreads
Debt Counts
Issuer Counts
6 22 April 2021
Cross-Sector: Market Data Highlights

MOODY'S ANALYTICS
CROSS-SECTOR
Duration
Aaa
Aa
A
Baa
Ba
B
Caa
>=1 and <3
10
30
38
57
264
415
566
>=3 and <5
20
37
50
75
281
410
548
>=5 and <7
28
53
67
101
286
356
541
>=7
43
97
113
151
298
420
569
Duration
Aaa
Aa
A
Baa
Ba
B
Caa
>=1 and <3
35
122
517
868
310
225
50
>=3 and <5
36
126
511
1010
301
216
73
>=5 and <7
24
87
402
839
189
107
24
>=7
44
299
1478
2070
224
46
6
Duration
Aaa
Aa
A
Baa
Ba
B
Caa
>=1 and <3
10
53
261
502
222
182
44
>=3 and <5
9
52
273
577
195
174
63
>=5 and <7
10
39
225
498
134
93
23
>=7
7
55
352
611
104
28
5
Source: Moody's
Issuer Counts
Figure 11. Global Corporate Median Credit Spreads
Median Spreads
Debt Counts
MEDIAN 5-YEAR CDS SPREADS
Global Median Spreads by Fine Rating Category
Aaa
Aa1
Aa2
Aa3
A1
A2
A3
Baa1
Baa2
14
17
21
26
33
41
46
52
58
Baa3
Ba1
Ba2
Ba3
B1
B2
B3
Caa
83
118
167
210
264
332
353
546
Global Median Spreads by Broad Rating Category
Aaa
Aa
A
Baa
Ba
B
Caa
19
38
41
58
167
332
399
Global Issuer Counts by Broad Rating Category
Aaa
Aa
A
Baa
Ba
B
Caa
9
53
168
345
100
44
31
Source: Moody's, CMA
Figure 12. Global Median CDS Spreads By Rating Category
7 22 April 2021
Cross-Sector: Market Data Highlights

MOODY'S ANALYTICS
CROSS-SECTOR
Region
Aaa
Aa
A
Baa
Ba
B
Caa
North America
19
36
41
65
165
293
408
Europe
9
29
40
57
141
238
522
Asia Pacific (ex.Japan)
17
23
41
68
146
341
-
Japan
-
-
23
28
52
72
-
Region
Aaa
Aa
A
Baa
Ba
B
Caa
North America
3
20
84
209
61
31
15
Europe
6
33
80
124
28
10
14
Asia Pacific (ex.Japan)
3
18
31
35
5
2
-
Japan
-
-
32
15
3
1
-
Source: Moody's, CMA
Issuer Counts
Figure 13. Median CDS Spreads By Region
Median CDS Spreads
Sector
Aaa
Aa
A
Baa
Ba
B
Caa
Corporates
22
31
37
61
159
275
557
Financials
10
29
41
61
155
370
296
Sovereigns
10
11
40
52
100
370
-
Banks
-
30
41
65
203
-
213
Sector
Aaa
Aa
A
Baa
Ba
B
Caa
Corporates
4
24
147
329
89
46
25
Financials
8
47
84
66
19
1
6
Banks
-
35
53
28
10
-
5
Sovereigns
8
6
4
6
3
1
-
Source: Moody's, CMA
Issuer Counts
Figure 14. Global Median CDS Spreads by Sector
Median CDS Spreads
8 22 April 2021
Cross-Sector: Market Data Highlights

MOODY'S ANALYTICS
CROSS-SECTOR
Region
Aaa
Aa
A
Baa
Ba
B
Caa
North America
10
43
44
66
191
-
528
Europe
9
29
42
61
129
-
213
Asia Pacific (ex.Japan)
16
22
41
67
100
370
-
Japan
-
-
26
45
-
-
-
Region
Aaa
Aa
A
Baa
Ba
B
Caa
North America
1
8
22
24
7
-
1
Europe
5
26
38
26
6
-
5
Asia Pacific (ex.Japan)
2
13
13
12
3
1
-
Japan
-
-
11
2
-
-
-
Source: Moody's, CMA
Figure 15. Global Financial Institutions Median CDS Spreads by Region
Median CDS Spreads
Issuer Counts
Region
Aaa
Aa
A
Baa
Ba
B
Caa
North America
22
34
38
65
162
293
402
Europe
9
24
36
53
141
238
615
Asia Pacific (ex.Japan)
31
26
41
68
155
313
-
Japan
-
-
22
28
52
72
-
Region
Aaa
Aa
A
Baa
Ba
B
Caa
North America
2
12
62
185
54
31
14
Europe
1
7
42
98
22
10
9
Asia Pacific (ex.Japan)
1
5
18
23
2
1
-
Japan
-
-
21
13
3
1
-
Source: Moody's, CMA
Median CDS Spreads
Issuer Counts
Figure 16. Global Corporates Median CDS Spreads by Region
9 22 April 2021
Cross-Sector: Market Data Highlights

MOODY'S ANALYTICS
CROSS-SECTOR
© 2021 Moody’s Corporation, Moody’s Investors Service, Inc. , Moody’s Analytics, Inc. and/or their licensors and affiliates (collectively, “MOODY’S”). All rights reserved.
CREDIT RATINGS ISSUED BY MOODY'S CREDIT RATINGS AFFILIATES ARE THEIR CURRENT OPINIONS OF THE RELATIVE FUTURE CREDIT RISK OF ENTITIES, CREDIT
COMMITMENTS, OR DEBT OR DEBT-LIKE SECURITIES, AND MATERIALS, PRODUCTS, SERVICES AND INFORMATION PUBLISHED BY MOODY’S (COLLECTIVELY,
“PUBLICATIONS”) MAY INCLUDE SUCH CURRENT OPINIONS. MOODY’S DEFINES CREDIT RISK AS THE RISK THAT AN ENTITY MAY NOT MEET ITS CONTRACTUAL
FINANCIAL OBLIGATIONS AS THEY COME DUE AND ANY ESTIMATED FINANCIAL LOSS IN THE EVENT OF DEFAULT OR IMPAIRMENT. SEE APPLICABLE MOODY’S
RATING SYMBOLS AND DEFINITIONS PUBLICATION FOR INFORMATION ON THE TYPES OF CONTRACTUAL FINANCIAL OBLIGATIONS ADDRESSED BY MOODY’S
CREDIT RATINGS. CREDIT RATINGS DO NOT ADDRESS ANY OTHER RISK, INCLUDING BUT NOT LIMITED TO: LIQUIDITY RISK, MARKET VALUE RISK, OR PRICE
VOLATILITY. CREDIT RATINGS, NON-CREDIT ASSESSMENTS (“ASSESSMENTS”), AND OTHER OPINIONS INCLUDED IN MOODY’S PUBLICATIONS ARE NOT
STATEMENTS OF CURRENT OR HISTORICAL FACT. MOODY’S PUBLICATIONS MAY ALSO INCLUDE QUANTITATIVE MODEL-BASED ESTIMATES OF CREDIT RISK AND
RELATED OPINIONS OR COMMENTARY PUBLISHED BY MOODY’S ANALYTICS, INC. AND/OR ITS AFFILIATES. MOODY’S CREDIT RATINGS, ASSESSMENTS, OTHER
OPINIONS AND PUBLICATIONS DO NOT CONSTITUTE OR PROVIDE INVESTMENT OR FINANCIAL ADVICE, AND MOODY’S CREDIT RATINGS, ASSESSMENTS, OTHER
OPINIONS AND PUBLICATIONS ARE NOT AND DO NOT PROVIDE RECOMMENDATIONS TO PURCHASE, SELL, OR HOLD PARTICULAR SECURITIES. MOODY’S CREDIT
RATINGS, ASSESSMENTS, OTHER OPINIONS AND PUBLICATIONS DO NOT COMMENT ON THE SUITABILITY OF AN INVESTMENT FOR ANY PARTICULAR INVESTOR.
MOODY’S ISSUES ITS CREDIT RATINGS, ASSESSMENTS AND OTHER OPINIONS AND PUBLISHES ITS PUBLICATIONS WITH THE EXPECTATION AND UNDERSTANDING
THAT EACH INVESTOR WILL, WITH DUE CARE, MAKE ITS OWN STUDY AND EVALUATION OF EACH SECURITY THAT IS UNDER CONSIDERATION FOR PURCHASE,
HOLDING, OR SALE.
MOODY’S CREDIT RATINGS, ASSESSMENTS, OTHER OPINIONS, AND PUBLICATIONS ARE NOT INTENDED FOR USE BY RETAIL INVESTORS AND IT WOULD BE RECKLESS
AND INAPPROPRIATE FOR RETAIL INVESTORS TO USE MOODY’S CREDIT RATINGS, ASSESSMENTS, OTHER OPINIONS OR PUBLICATIONS WHEN MAKING AN INVESTMENT
DECISION. IF IN DOUBT YOU SHOULD CONTACT YOUR FINANCIAL OR OTHER PROFESSIONAL ADVISER.
ALL INFORMATION CONTAINED HEREIN IS PROTECTED BY LAW, INCLUDING BUT NOT LIMITED TO, COPYRIGHT LAW, AND NONE OF SUCH INFORMATION MAY BE COPIED
OR OTHERWISE REPRODUCED, REPACKAGED, FURTHER TRANSMITTED, TRANSFERRED, DISSEMINATED, REDISTRIBUTED OR RESOLD, OR STORED FOR SUBSEQUENT USE
FOR ANY SUCH PURPOSE, IN WHOLE OR IN PART, IN ANY FORM OR MANNER OR BY ANY MEANS WHATSOEVER, BY ANY PERSON WITHOUT MOODY’S PRIOR WRITTEN
CONSENT.
MOODY’S CREDIT RATINGS, ASSESSMENTS, OTHER OPINIONS AND PUBLICATIONS ARE NOT INTENDED FOR USE BY ANY PERSON AS A BENCHMARK AS THAT TERM IS
DEFINED FOR REGULATORY PURPOSES AND MUST NOT BE USED IN ANY WAY THAT COULD RESULT IN THEM BEING CONSIDERED A BENCHMARK.
All information contained herein is obtained by MOODY’S from sources believed by it to be accurate and reliable. Because of the possibility of human or mechanical error as well
as other factors, however, all information contained herein is provided “AS IS” without warranty of any kind. MOODY'S adopts all necessary measures so that the information it
uses in assigning a credit rating is of sufficient quality and from sources MOODY'S considers to be reliable including, when appropriate, independent third-party sources. However,
MOODY’S is not an auditor and cannot in every instance independently verify or validate information received in the rating process or in preparing its Publications.
To the extent permitted by law, MOODY’S and its directors, officers, employees, agents, representatives, licensors and suppliers disclaim liability to any person or entity for any
indirect, special, consequential, or incidental losses or damages whatsoever arising from or in connection with the information contained herein or the use of or inability to use any
such information, even if MOODY’S or any of its directors, officers, employees, agents, representatives, licensors or suppliers is advised in advance of the possibility of such losses or
damages, including but not limited to: (a) any loss of present or prospective profits or (b) any loss or damage arising where the relevant financial instrument is not the subject of a
particular credit rating assigned by MOODY’S.
To the extent permitted by law, MOODY’S and its directors, officers, employees, agents, representatives, licensors and suppliers disclaim liability for any direct or compensatory
losses or damages caused to any person or entity, including but not limited to by any negligence (but excluding fraud, willful misconduct or any other type of liability that, for the
avoidance of doubt, by law cannot be excluded) on the part of, or any contingency within or beyond the control of, MOODY’S or any of its directors, officers, employees, agents,
representatives, licensors or suppliers, arising from or in connection with the information contained herein or the use of or inability to use any such information.
NO WARRANTY, EXPRESS OR IMPLIED, AS TO THE ACCURACY, TIMELINESS, COMPLETENESS, MERCHANTABILITY OR FITNESS FOR ANY PARTICULAR PURPOSE OF ANY CREDIT
RATING, ASSESSMENT, OTHER OPINION OR INFORMATION IS GIVEN OR MADE BY MOODY’S IN ANY FORM OR MANNER WHATSOEVER.
Moody’s Investors Service, Inc. , a wholly-owned credit rating agency subsidiary of Moody’s Corporation (“MCO”), hereby discloses that most issuers of debt securities (including
corporate and municipal bonds, debentures, notes and commercial paper) and preferred stock rated by Moody’s Investors Service, Inc. have, prior to assignment of any credit rating,
agreed to pay to Moody’s Investors Service, Inc. for credit ratings opinions and services rendered by it fees ranging from $1,000 to approximately $5,000,000 . MCO and Moody’s
Investors Service also maintain policies and procedures to address the independence of Moody’s Investors Service credit ratings and credit rating processes. Information regarding
certain affiliations that may exist between directors of MCO and rated entities, and between entities who hold credit ratings from Moody’s Investors Service and have also publicly
reported to the SEC an ownership interest in MCO of more than 5%, is posted annually at
under the heading “Investor Relations — Corporate Governance —
Director and Shareholder Affiliation Policy.”
Additional terms for Australia only: Any publication into Australia of this document is pursuant to the Australian Financial Services License of MOODY’S affiliate, Moody’s Investors
Service Pty Limited ABN 61 003 399 657AFSL 336969 and/or Moody’s Analytics Australia Pty Ltd ABN 94 105 136 972 AFSL 383569 (as applicable). This document is intended
to be provided only to “wholesale clients” within the meaning of section 761G of the Corporations Act 2001. By continuing to access this document from within Australia , you
represent to MOODY’S that you are, or are accessing the document as a representative of, a “wholesale client” and that neither you nor the entity you represent will directly or
indirectly disseminate this document or its contents to “retail clients” within the meaning of section 761G of the Corporations Act 2001. MOODY’S credit rating is an opinion as to
the creditworthiness of a debt obligation of the issuer, not on the equity securities of the issuer or any form of security that is available to retail investors.
Additional terms for Japan only: Moody's Japan K.K. (“MJKK”) is a wholly-owned credit rating agency subsidiary of Moody's Group Japan G.K., which is wholly-owned by Moody’s
Overseas Holdings Inc. , a wholly-owned subsidiary of MCO. Moody’s SF Japan K.K. (“MSFJ”) is a wholly-owned credit rating agency subsidiary of MJKK. MSFJ is not a Nationally
Recognized Statistical Rating Organization (“NRSRO”). Therefore, credit ratings assigned by MSFJ are Non-NRSRO Credit Ratings. Non-NRSRO Credit Ratings are assigned by an
entity that is not a NRSRO and, consequently, the rated obligation will not qualify for certain types of treatment under U.S. laws. MJKK and MSFJ are credit rating agencies registered
with the Japan Financial Services Agency and their registration numbers are FSA Commissioner (Ratings) No. 2 and 3 respectively.
MJKK or MSFJ (as applicable) hereby disclose that most issuers of debt securities (including corporate and municipal bonds, debentures, notes and commercial paper) and preferred
stock rated by MJKK or MSFJ (as applicable) have, prior to assignment of any credit rating, agreed to pay to MJKK or MSFJ (as applicable) for credit ratings opinions and services
rendered by it fees ranging from JPY125,000 to approximately JPY550,000,000 .
MJKK and MSFJ also maintain policies and procedures to address Japanese regulatory requirements.
REPORT NUMBER
1279912
10 22 April 2021
Cross-Sector: Market Data Highlights

MOODY'S ANALYTICS
CROSS-SECTOR
CLIENT SERVICES
Americas
1-212-553-1653
Asia Pacific
852-3551-3077
Japan
81-3-5408-4100
EMEA
44-20-7772-5454
11 22 April 2021
Cross-Sector: Market Data Highlights
