Cross-Sector: Market Data Highlights
CROSS-SECTOR
DATA REPORT
11 February 2021
CLIENT SERVICES
Americas
1-212-553-1653
Asia Pacific
852-3551-3077
Japan
81-3-5408-4100
EMEA
44-20-7772-5454
Cross-Sector
Market Data Highlights
The latest market data from Weekly Market Outlook. Click
for access to the full WMO.
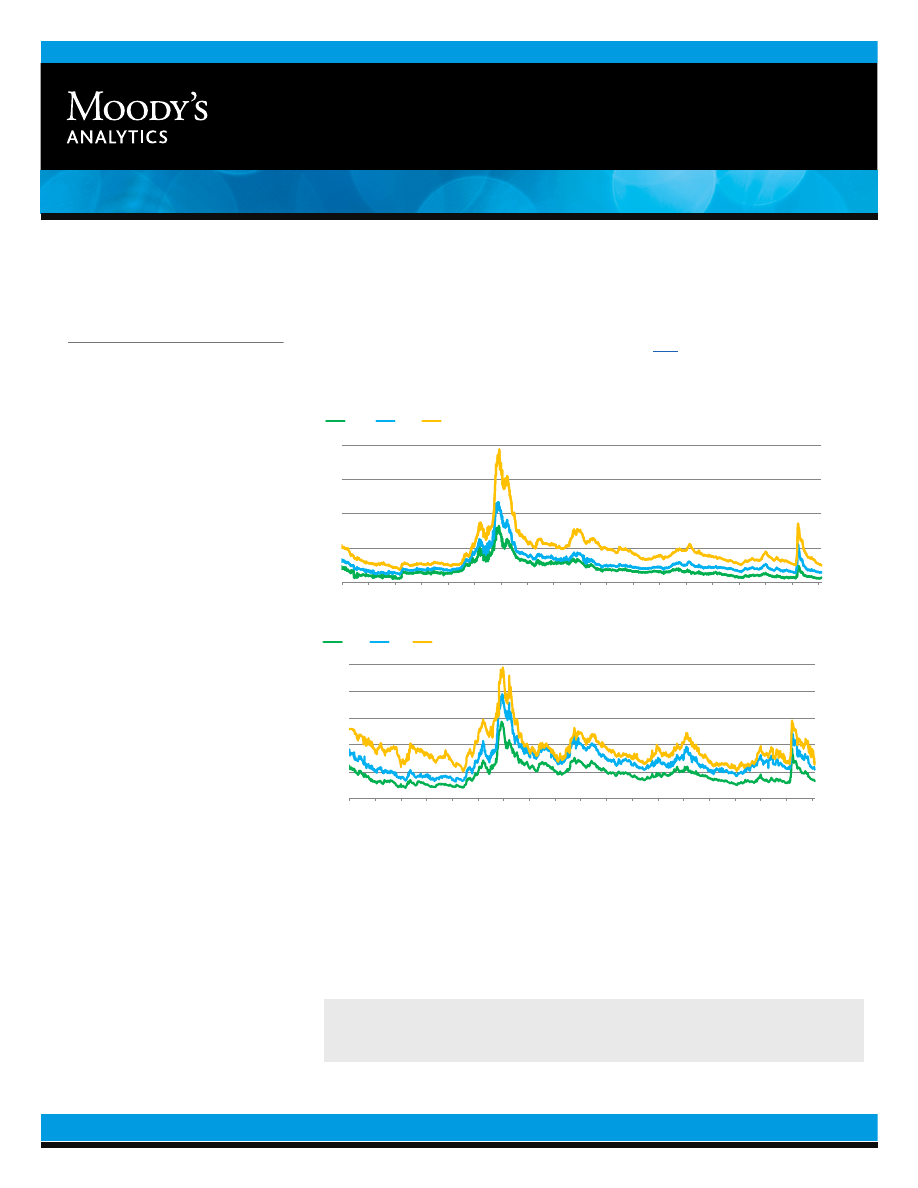
SPREADS
0
200
400
600
800
0
200
400
600
800
2003 2004 2005 2006 2007 2008 2009 2010 2011 2012 2013 2014 2015 2016 2017 2018 2019 2020 2021
Spread (bp)
Spread (bp)
Aa2
A2
Baa2
Source: Moody's
Figure 1: 5-Year Median Spreads-Global Data (High Grade)
0
400
800
1,200
1,600
2,000
0
400
800
1,200
1,600
2,000
2003 2004 2005 2006 2007 2008 2009 2010 2011 2012 2013 2014 2015 2016 2017 2018 2019 2020 2021
Spread (bp)
Spread (bp)
Ba2
B2
Caa-C
Source: Moody's
Figure 2: 5-Year Median Spreads-Global Data (High Yield)
Moody’s Analytics markets and distributes all Moody’s Capital Markets Research, Inc. materials. Moody’s Capital Markets
Research,Inc. is a subsidiary of Moody’s Corporation. Moody’s Analytics does not provide investment advisory services or
products. For further detail, please see the last page.

MOODY'S ANALYTICS
CROSS-SECTOR
CDS MOVERS
CDS Implied Rating Rises
Issuer
Feb. 10
Feb. 3
Senior Ratings
American Express Credit Corporation
Aa2
A1
A2
Burlington Resources LLC
Aa3
A2
A3
Ford Motor Credit Company LLC
Ba2
Ba3
Ba2
International Business Machines Corporation
A2
A3
A2
Occidental Petroleum Corporation
B3
Caa1
Ba2
NextEra Energy Capital Holdings, Inc.
Baa1
Baa2
Baa1
Sempra Energy
A2
A3
Baa2
Southwest Airlines Co.
Baa3
Ba1
Baa1
Pioneer Natural Resources Company
Baa2
Baa3
Baa2
Eastman Chemical Company
Baa1
Baa2
Baa3
CDS Implied Rating Declines
Issuer
Feb. 10
Feb. 3
Senior Ratings
International Paper Company
A2
Aa3
Baa2
Entergy Corporation
Aa3
Aa1
Baa2
Verizon Communications Inc.
Baa2
Baa1
Baa1
John Deere Capital Corporation
Baa2
Baa1
A2
Exxon Mobil Corporation
A2
A1
Aa1
Merck & Co., Inc.
Aa3
Aa2
A1
Union Pacific Corporation
Aa1
Aaa
Baa1
General Motors Company
Ba1
Baa3
Baa3
Cox Communications, Inc.
Baa1
A3
Baa2
Waste Management, Inc.
Baa2
Baa1
Baa1
CDS Spread Increases
Issuer
Senior Ratings
Feb. 10
Feb. 3
Spread Diff
United States Steel Corporation
Caa2
441
401
41
Nordstrom, Inc.
Baa3
291
273
18
DPL Inc.
Ba1
353
336
18
Commercial Metals Company
Ba2
293
277
16
First Industrial, L.P.
Baa2
245
232
13
Univision Communications Inc.
Caa2
433
422
11
Pactiv Corporation
Caa1
293
282
11
Entergy Corporation
Baa2
38
30
9
Service Corporation International
Ba3
164
156
8
JetBlue Airways Corp.
Ba3
555
547
8
CDS Spread Decreases
Issuer
Senior Ratings
Feb. 10
Feb. 3
Spread Diff
Nabors Industries , Inc.
Caa2
1,037
1,257
-220
K. Hovnanian Enterprises, Inc.
Caa3
933
1,138
-205
United Airlines Holdings, Inc.
Ba3
497
577
-79
Murphy Oil Corporation
Ba3
425
481
-56
Occidental Petroleum Corporation
Ba2
297
351
-54
L Brands, Inc.
B2
187
227
-40
Goodyear Tire & Rubber Company (The)
B2
257
297
-40
Ford Motor Credit Company LLC
Ba2
164
202
-39
Talen Energy Supply, LLC
B3
1,069
1,108
-39
American Axle & Manufacturing , Inc.
B2
360
398
-38
Source: Moody's, CMA
CDS Spreads
CDS Implied Ratings
CDS Implied Ratings
CDS Spreads
Figure 3. CDS Movers - US ( February 3, 2021 February 10, 2021)
2 11 February 2021
Cross-Sector: Market Data Highlights
MOODY'S ANALYTICS
CROSS-SECTOR
CDS Implied Rating Rises
Issuer
Feb. 10
Feb. 3
Senior Ratings
Spain , Government of
Aa2
A1
Baa1
Natixis
Aa1
Aa2
A1
UniCredit Bank AG
Aa1
Aa2
A2
Swedbank AB
Aa1
Aa2
Aa3
Vodafone Group Plc
A3
Baa1
Baa2
Total SE
Aa1
Aa2
Aa3
Bayerische Motoren Werke Aktiengesellschaft
A2
A3
A2
SEB AB
Aa1
Aa2
Aa2
Volkswagen Aktiengesellschaft
Baa2
Baa3
A3
HSBC Bank plc
Aa1
Aa2
A1
CDS Implied Rating Declines
Issuer
Feb. 10
Feb. 3
Senior Ratings
Landesbank Hessen-Thueringen GZ
Baa2
Baa1
Aa3
Anheuser-Busch InBev SA /NV
Baa1
A3
Baa1
KBC Bank N.V.
Aa2
Aa1
Aa3
Banca Monte dei Paschi di Siena S.p.A .
Ba3
Ba2
Caa1
FCE Bank plc
Ba3
Ba2
Ba2
Credit Suisse AG
A2
A1
Aa3
Atlantia S.p.A .
Ba3
Ba2
Ba3
Bank of Scotland plc
A2
A1
A1
National Bank of Greece S.A.
B3
B2
Caa1
Ardagh Packaging Finance plc
B1
Ba3
Caa1
CDS Spread Increases
Issuer
Senior Ratings
Feb. 10
Feb. 3
Spread Diff
Deutsche Lufthansa Aktiengesellschaft
Ba2
313
300
13
Sappi Papier Holding GmbH
Ba2
354
341
13
Permanent tsb p.l.c.
Baa2
220
211
9
Alpha Bank AE
Caa1
423
417
7
Boparan Finance plc
Caa1
586
581
5
Stena AB
Caa1
633
627
5
EWE AG
Baa1
110
106
4
3i Group plc
Baa1
97
93
4
Stagecoach Group Plc
Baa3
80
76
4
Anheuser-Busch InBev SA /NV
Baa1
49
46
3
CDS Spread Decreases
Issuer
Senior Ratings
Feb. 10
Feb. 3
Spread Diff
TUI AG
Caa1
730
765
-35
Novafives S.A.S .
Caa2
882
916
-34
Iceland Bondco plc
Caa2
337
370
-32
Casino Guichard-Perrachon SA
Caa1
585
613
-28
CMA CGM S.A.
Caa1
408
427
-19
Telecom Italia S.p.A .
Ba2
159
174
-14
Jaguar Land Rover Automotive Plc
B1
387
401
-14
Ziggo Bond Company B.V.
B3
198
210
-12
RCI Banque
Baa2
172
182
-10
Avon Products, Inc.
B1
214
224
-10
Source: Moody's, CMA
CDS Spreads
CDS Implied Ratings
CDS Implied Ratings
CDS Spreads
Figure 4. CDS Movers - Europe ( February 3, 2021 February 10, 2021)
3 11 February 2021
Cross-Sector: Market Data Highlights
MOODY'S ANALYTICS
CROSS-SECTOR
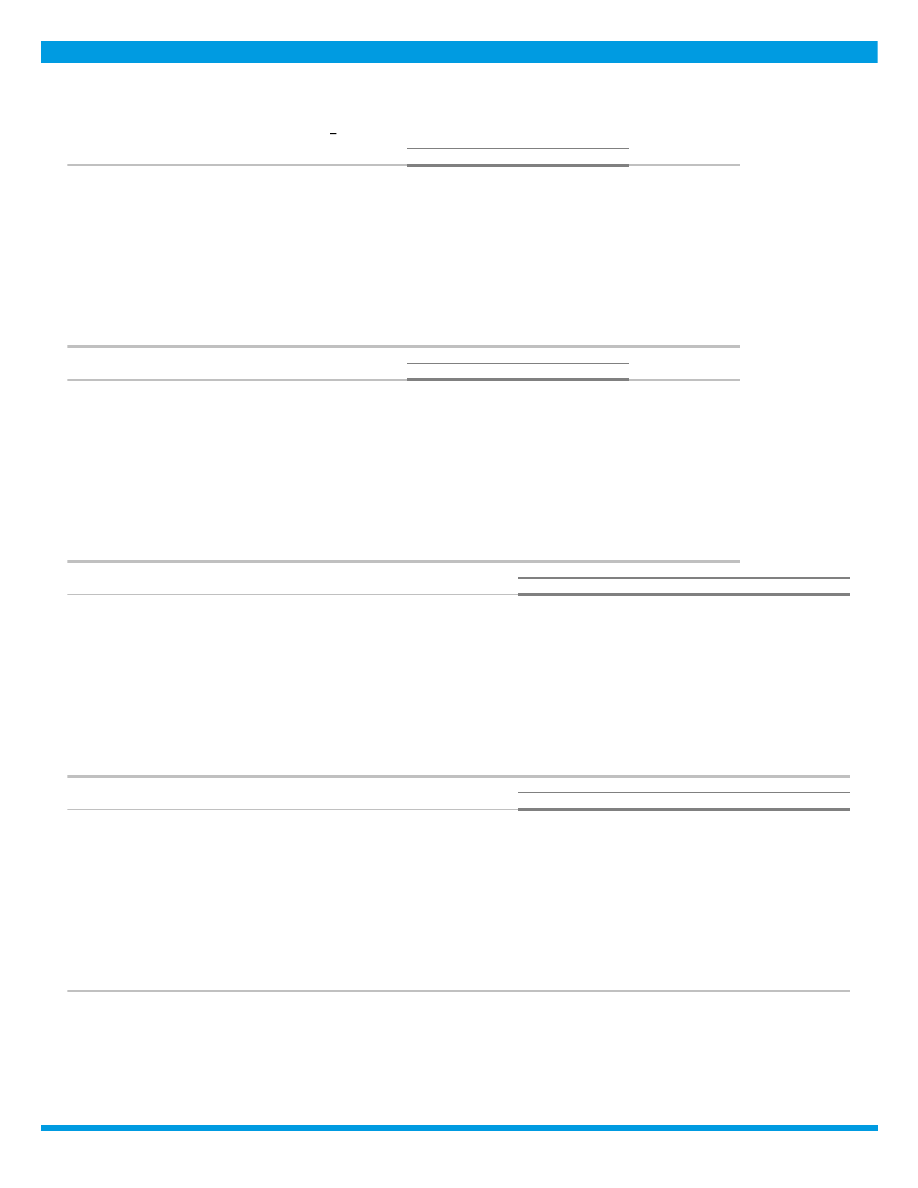
ISSUANCE
0
700
1,400
2,100
2,800
0
700
1,400
2,100
2,800
Jan Feb Mar
Apr
May
Jun
Jul
Aug
Sep
Oct
Nov
Dec
Issuance ($B)
Issuance ($B)
2018
2019
2020
2021
Source:
Moody's / Dealogic
Figure 5. Market Cumulative Issuance - Corporate & Financial Institutions: USD Denominated
0
200
400
600
800
1,000
0
200
400
600
800
1,000
Jan Feb Mar
Apr
May
Jun
Jul
Aug
Sep
Oct
Nov
Dec
Issuance ($B)
Issuance ($B)
2018
2019
2020
2021
Source:
Moody's / Dealogic
Figure 6. Market Cumulative Issuance - Corporate & Financial Institutions: Euro Denominated
4 11 February 2021
Cross-Sector: Market Data Highlights

MOODY'S ANALYTICS
CROSS-SECTOR
Investment-Grade
High-Yield
Total*
Amount
Amount
Amount
$B
$B
$B
Weekly
53.769
11.219
67.127
Year-to-Date
211.396
89.171
311.011
Investment-Grade
High-Yield
Total*
Amount
Amount
Amount
$B
$B
$B
Weekly
16.197
2.791
20.558
Year-to-Date
91.574
20.156
114.651
* Difference represents issuance with pending ratings.
Source: Moody's/ Dealogic
USD Denominated
Euro Denominated
Figure 7. Issuance: Corporate & Financial Institutions
EMERGING MARKET CREDIT SPREADS
Emerging Market
Duration
A
Baa
Ba
B
A
Baa
Ba
B
>=1 and <3
63
102
267
408
74
130
59
48
>=3 and <5
82
133
270
414
65
124
47
47
>=5 and <7
104
157
313
471
48
85
28
17
>=7
121
210
347
541
116
212
55
38
Emerging Market Sovereign
Duration
A
Baa
Ba
B
A
Baa
Ba
B
>=1 and <3
28
64
118
342
16
33
16
20
>=3 and <5
44
82
193
404
16
35
22
28
>=5 and <7
94
115
265
477
15
35
19
16
>=7
71
179
333
537
68
108
46
37
Emerging Market Corporate
Duration
A
Baa
Ba
B
A
Baa
Ba
B
>=1 and <3
71
116
289
455
58
97
43
28
>=3 and <5
89
147
304
474
49
89
25
19
>=5 and <7
111
186
411
315
33
50
9
1
>=7
155
235
573
683
48
104
9
1
Source: Moody's
Median Spreads
Bond Counts
Median Spreads
Bond Counts
Figure 8. Emerging Market Median OAS
Bond Counts
Median Spreads
5 11 February 2021
Cross-Sector: Market Data Highlights
MOODY'S ANALYTICS
CROSS-SECTOR
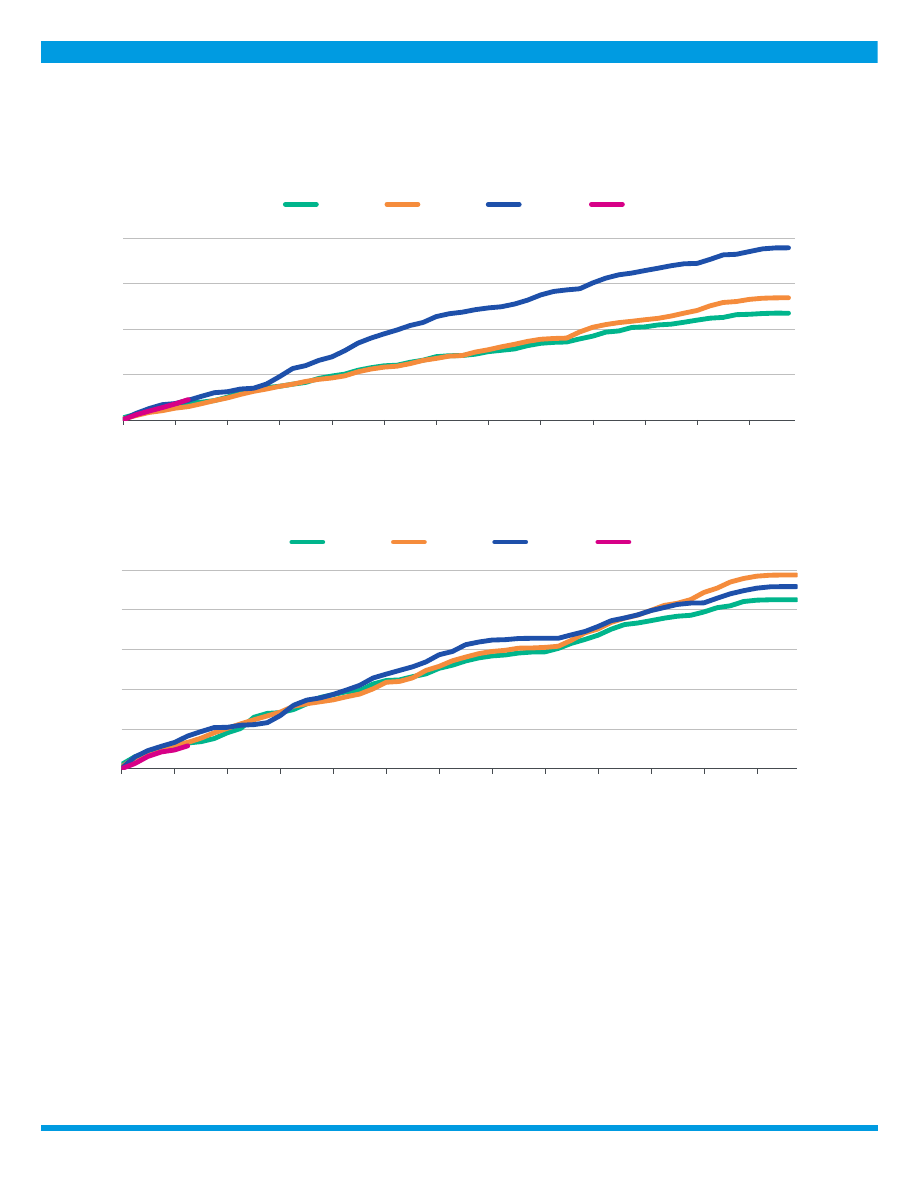
0
600
1,200
1,800
2,400
0
600
1,200
1,800
2,400
2003 2004 2005 2006 2007 2008 2009 2010 2011 2012 2013 2014 2015 2016 2017 2018 2019 2020 2021
Spread (bp)
Spread (bp)
A
Baa
Ba
B
Source: Moody's
Figure 9: Emerging Markets Median Credit Spreads (3-5 year duration)
MEDIAN CREDIT SPREADS
Duration
Aaa
Aa
A
Baa
Ba
B
Caa
>=1 and <3
4
26
38
68
215
421
516
>=3 and <5
8
35
49
100
264
479
500
>=5 and <7
23
30
68
122
285
342
-
>=7
34
35
108
164
208
-
405
Duration
Aaa
Aa
A
Baa
Ba
B
Caa
>=1 and <3
377
260
446
291
77
27
6
>=3 and <5
206
163
373
295
68
14
3
>=5 and <7
94
117
217
149
18
2
-
>=7
99
277
416
245
13
-
2
Duration
Aaa
Aa
A
Baa
Ba
B
Caa
>=1 and <3
25
79
174
165
48
24
6
>=3 and <5
27
74
160
165
39
14
3
>=5 and <7
23
56
102
91
13
2
-
>=7
29
89
155
117
10
-
1
Source: Moody's
Figure 10. Global Financial Institutions Median Credit Spreads
Median Spreads
Debt Counts
Issuer Counts
6 11 February 2021
Cross-Sector: Market Data Highlights
MOODY'S ANALYTICS
CROSS-SECTOR
Duration
Aaa
Aa
A
Baa
Ba
B
Caa
>=1 and <3
9
27
34
54
256
388
516
>=3 and <5
26
39
44
67
264
421
592
>=5 and <7
22
48
59
93
285
384
681
>=7
53
106
119
158
317
470
575
Duration
Aaa
Aa
A
Baa
Ba
B
Caa
>=1 and <3
39
136
559
893
355
267
64
>=3 and <5
33
126
503
986
291
198
61
>=5 and <7
21
90
416
829
152
70
14
>=7
34
292
1428
1979
198
32
8
Duration
Aaa
Aa
A
Baa
Ba
B
Caa
>=1 and <3
10
57
268
503
254
204
53
>=3 and <5
6
52
266
566
192
160
56
>=5 and <7
8
41
229
482
104
61
13
>=7
7
55
350
589
84
14
6
Source: Moody's
Issuer Counts
Figure 11. Global Corporate Median Credit Spreads
Median Spreads
Debt Counts
MEDIAN 5-YEAR CDS SPREADS
Global Median Spreads by Fine Rating Category
Aaa
Aa1
Aa2
Aa3
A1
A2
A3
Baa1
Baa2
19
26
36
38
39
41
45
49
54
Baa3
Ba1
Ba2
Ba3
B1
B2
B3
Caa
78
112
162
189
220
257
307
511
Global Median Spreads by Broad Rating Category
Aaa
Aa
A
Baa
Ba
B
Caa
22
36
41
54
162
257
437
Global Issuer Counts by Broad Rating Category
Aaa
Aa
A
Baa
Ba
B
Caa
9
54
171
344
99
47
31
Source: Moody's, CMA
Figure 12. Global Median CDS Spreads By Rating Category
7 11 February 2021
Cross-Sector: Market Data Highlights

MOODY'S ANALYTICS
CROSS-SECTOR
Region
Aaa
Aa
A
Baa
Ba
B
Caa
North America
22
36
38
62
152
255
395
Europe
10
27
38
54
121
210
552
Asia Pacific (ex.Japan)
14
22
35
61
163
357
-
Japan
-
-
24
29
51
70
-
Region
Aaa
Aa
A
Baa
Ba
B
Caa
North America
3
20
85
210
60
34
14
Europe
6
34
81
122
28
10
15
Asia Pacific (ex.Japan)
3
18
31
35
5
2
-
Japan
-
-
35
13
3
1
-
Source: Moody's, CMA
Issuer Counts
Figure 13. Median CDS Spreads By Region
Median CDS Spreads
Sector
Aaa
Aa
A
Baa
Ba
B
Caa
Corporates
23
30
35
58
154
240
497
Financials
11
27
35
59
157
366
376
Sovereigns
11
14
32
47
90
366
-
Banks
-
27
37
59
170
-
330
Sector
Aaa
Aa
A
Baa
Ba
B
Caa
Corporates
4
25
153
324
88
49
25
Financials
8
47
84
68
19
1
6
Banks
-
35
53
29
10
-
5
Sovereigns
8
6
4
6
3
1
-
Source: Moody's, CMA
Figure 14. Global Median CDS Spreads by Sector
Median CDS Spreads
Issuer Counts
8 11 February 2021
Cross-Sector: Market Data Highlights

MOODY'S ANALYTICS
CROSS-SECTOR
Region
Aaa
Aa
A
Baa
Ba
B
Caa
North America
11
40
42
70
164
-
639
Europe
10
27
40
57
129
-
330
Asia Pacific (ex.Japan)
14
22
34
59
90
366
-
Japan
-
-
25
39
-
-
-
Region
Aaa
Aa
A
Baa
Ba
B
Caa
North America
1
8
22
24
7
-
1
Europe
5
26
38
27
6
-
5
Asia Pacific (ex.Japan)
2
13
13
13
3
1
-
Japan
-
-
11
2
-
-
-
Source: Moody's, CMA
Figure 15. Global Financial Institutions Median CDS Spreads by Region
Median CDS Spreads
Issuer Counts
Region
Aaa
Aa
A
Baa
Ba
B
Caa
North America
23
33
38
62
151
255
358
Europe
10
28
36
50
121
210
609
Asia Pacific (ex.Japan)
28
29
35
61
164
348
-
Japan
-
-
24
27
51
70
-
Region
Aaa
Aa
A
Baa
Ba
B
Caa
North America
2
12
63
186
53
34
13
Europe
1
8
43
95
22
10
10
Asia Pacific (ex.Japan)
1
5
18
22
2
1
-
Japan
-
-
24
11
3
1
-
Source: Moody's, CMA
Median CDS Spreads
Issuer Counts
Figure 16. Global Corporates Median CDS Spreads by Region
9 11 February 2021
Cross-Sector: Market Data Highlights

MOODY'S ANALYTICS
CROSS-SECTOR
© 2021 Moody’s Corporation, Moody’s Investors Service, Inc. , Moody’s Analytics, Inc. and/or their licensors and affiliates (collectively, “MOODY’S”). All rights reserved.
CREDIT RATINGS ISSUED BY MOODY'S CREDIT RATINGS AFFILIATES ARE THEIR CURRENT OPINIONS OF THE RELATIVE FUTURE CREDIT RISK OF ENTITIES, CREDIT
COMMITMENTS, OR DEBT OR DEBT-LIKE SECURITIES, AND MATERIALS, PRODUCTS, SERVICES AND INFORMATION PUBLISHED BY MOODY’S (COLLECTIVELY,
“PUBLICATIONS”) MAY INCLUDE SUCH CURRENT OPINIONS. MOODY’S DEFINES CREDIT RISK AS THE RISK THAT AN ENTITY MAY NOT MEET ITS CONTRACTUAL
FINANCIAL OBLIGATIONS AS THEY COME DUE AND ANY ESTIMATED FINANCIAL LOSS IN THE EVENT OF DEFAULT OR IMPAIRMENT. SEE APPLICABLE MOODY’S
RATING SYMBOLS AND DEFINITIONS PUBLICATION FOR INFORMATION ON THE TYPES OF CONTRACTUAL FINANCIAL OBLIGATIONS ADDRESSED BY MOODY’S
CREDIT RATINGS. CREDIT RATINGS DO NOT ADDRESS ANY OTHER RISK, INCLUDING BUT NOT LIMITED TO: LIQUIDITY RISK, MARKET VALUE RISK, OR PRICE
VOLATILITY. CREDIT RATINGS, NON-CREDIT ASSESSMENTS (“ASSESSMENTS”), AND OTHER OPINIONS INCLUDED IN MOODY’S PUBLICATIONS ARE NOT
STATEMENTS OF CURRENT OR HISTORICAL FACT. MOODY’S PUBLICATIONS MAY ALSO INCLUDE QUANTITATIVE MODEL-BASED ESTIMATES OF CREDIT RISK AND
RELATED OPINIONS OR COMMENTARY PUBLISHED BY MOODY’S ANALYTICS, INC. AND/OR ITS AFFILIATES. MOODY’S CREDIT RATINGS, ASSESSMENTS, OTHER
OPINIONS AND PUBLICATIONS DO NOT CONSTITUTE OR PROVIDE INVESTMENT OR FINANCIAL ADVICE, AND MOODY’S CREDIT RATINGS, ASSESSMENTS, OTHER
OPINIONS AND PUBLICATIONS ARE NOT AND DO NOT PROVIDE RECOMMENDATIONS TO PURCHASE, SELL, OR HOLD PARTICULAR SECURITIES. MOODY’S CREDIT
RATINGS, ASSESSMENTS, OTHER OPINIONS AND PUBLICATIONS DO NOT COMMENT ON THE SUITABILITY OF AN INVESTMENT FOR ANY PARTICULAR INVESTOR.
MOODY’S ISSUES ITS CREDIT RATINGS, ASSESSMENTS AND OTHER OPINIONS AND PUBLISHES ITS PUBLICATIONS WITH THE EXPECTATION AND UNDERSTANDING
THAT EACH INVESTOR WILL, WITH DUE CARE, MAKE ITS OWN STUDY AND EVALUATION OF EACH SECURITY THAT IS UNDER CONSIDERATION FOR PURCHASE,
HOLDING, OR SALE.
MOODY’S CREDIT RATINGS, ASSESSMENTS, OTHER OPINIONS, AND PUBLICATIONS ARE NOT INTENDED FOR USE BY RETAIL INVESTORS AND IT WOULD BE RECKLESS
AND INAPPROPRIATE FOR RETAIL INVESTORS TO USE MOODY’S CREDIT RATINGS, ASSESSMENTS, OTHER OPINIONS OR PUBLICATIONS WHEN MAKING AN INVESTMENT
DECISION. IF IN DOUBT YOU SHOULD CONTACT YOUR FINANCIAL OR OTHER PROFESSIONAL ADVISER.
ALL INFORMATION CONTAINED HEREIN IS PROTECTED BY LAW, INCLUDING BUT NOT LIMITED TO, COPYRIGHT LAW, AND NONE OF SUCH INFORMATION MAY BE COPIED
OR OTHERWISE REPRODUCED, REPACKAGED, FURTHER TRANSMITTED, TRANSFERRED, DISSEMINATED, REDISTRIBUTED OR RESOLD, OR STORED FOR SUBSEQUENT USE
FOR ANY SUCH PURPOSE, IN WHOLE OR IN PART, IN ANY FORM OR MANNER OR BY ANY MEANS WHATSOEVER, BY ANY PERSON WITHOUT MOODY’S PRIOR WRITTEN
CONSENT.
MOODY’S CREDIT RATINGS, ASSESSMENTS, OTHER OPINIONS AND PUBLICATIONS ARE NOT INTENDED FOR USE BY ANY PERSON AS A BENCHMARK AS THAT TERM IS
DEFINED FOR REGULATORY PURPOSES AND MUST NOT BE USED IN ANY WAY THAT COULD RESULT IN THEM BEING CONSIDERED A BENCHMARK.
All information contained herein is obtained by MOODY’S from sources believed by it to be accurate and reliable. Because of the possibility of human or mechanical error as well
as other factors, however, all information contained herein is provided “AS IS” without warranty of any kind. MOODY'S adopts all necessary measures so that the information it
uses in assigning a credit rating is of sufficient quality and from sources MOODY'S considers to be reliable including, when appropriate, independent third-party sources. However,
MOODY’S is not an auditor and cannot in every instance independently verify or validate information received in the rating process or in preparing its Publications.
To the extent permitted by law, MOODY’S and its directors, officers, employees, agents, representatives, licensors and suppliers disclaim liability to any person or entity for any
indirect, special, consequential, or incidental losses or damages whatsoever arising from or in connection with the information contained herein or the use of or inability to use any
such information, even if MOODY’S or any of its directors, officers, employees, agents, representatives, licensors or suppliers is advised in advance of the possibility of such losses or
damages, including but not limited to: (a) any loss of present or prospective profits or (b) any loss or damage arising where the relevant financial instrument is not the subject of a
particular credit rating assigned by MOODY’S.
To the extent permitted by law, MOODY’S and its directors, officers, employees, agents, representatives, licensors and suppliers disclaim liability for any direct or compensatory
losses or damages caused to any person or entity, including but not limited to by any negligence (but excluding fraud, willful misconduct or any other type of liability that, for the
avoidance of doubt, by law cannot be excluded) on the part of, or any contingency within or beyond the control of, MOODY’S or any of its directors, officers, employees, agents,
representatives, licensors or suppliers, arising from or in connection with the information contained herein or the use of or inability to use any such information.
NO WARRANTY, EXPRESS OR IMPLIED, AS TO THE ACCURACY, TIMELINESS, COMPLETENESS, MERCHANTABILITY OR FITNESS FOR ANY PARTICULAR PURPOSE OF ANY CREDIT
RATING, ASSESSMENT, OTHER OPINION OR INFORMATION IS GIVEN OR MADE BY MOODY’S IN ANY FORM OR MANNER WHATSOEVER.
Moody’s Investors Service, Inc. , a wholly-owned credit rating agency subsidiary of Moody’s Corporation (“MCO”), hereby discloses that most issuers of debt securities (including
corporate and municipal bonds, debentures, notes and commercial paper) and preferred stock rated by Moody’s Investors Service, Inc. have, prior to assignment of any credit rating,
agreed to pay to Moody’s Investors Service, Inc. for credit ratings opinions and services rendered by it fees ranging from $1,000 to approximately $5,000,000 . MCO and Moody’s
Investors Service also maintain policies and procedures to address the independence of Moody’s Investors Service credit ratings and credit rating processes. Information regarding
certain affiliations that may exist between directors of MCO and rated entities, and between entities who hold credit ratings from Moody’s Investors Service and have also publicly
reported to the SEC an ownership interest in MCO of more than 5%, is posted annually at
under the heading “Investor Relations — Corporate Governance —
Director and Shareholder Affiliation Policy.”
Additional terms for Australia only: Any publication into Australia of this document is pursuant to the Australian Financial Services License of MOODY’S affiliate, Moody’s Investors
Service Pty Limited ABN 61 003 399 657AFSL 336969 and/or Moody’s Analytics Australia Pty Ltd ABN 94 105 136 972 AFSL 383569 (as applicable). This document is intended
to be provided only to “wholesale clients” within the meaning of section 761G of the Corporations Act 2001. By continuing to access this document from within Australia , you
represent to MOODY’S that you are, or are accessing the document as a representative of, a “wholesale client” and that neither you nor the entity you represent will directly or
indirectly disseminate this document or its contents to “retail clients” within the meaning of section 761G of the Corporations Act 2001. MOODY’S credit rating is an opinion as to
the creditworthiness of a debt obligation of the issuer, not on the equity securities of the issuer or any form of security that is available to retail investors.
Additional terms for Japan only: Moody's Japan K.K. (“MJKK”) is a wholly-owned credit rating agency subsidiary of Moody's Group Japan G.K., which is wholly-owned by Moody’s
Overseas Holdings Inc. , a wholly-owned subsidiary of MCO. Moody’s SF Japan K.K. (“MSFJ”) is a wholly-owned credit rating agency subsidiary of MJKK. MSFJ is not a Nationally
Recognized Statistical Rating Organization (“NRSRO”). Therefore, credit ratings assigned by MSFJ are Non-NRSRO Credit Ratings. Non-NRSRO Credit Ratings are assigned by an
entity that is not a NRSRO and, consequently, the rated obligation will not qualify for certain types of treatment under U.S. laws. MJKK and MSFJ are credit rating agencies registered
with the Japan Financial Services Agency and their registration numbers are FSA Commissioner (Ratings) No. 2 and 3 respectively.
MJKK or MSFJ (as applicable) hereby disclose that most issuers of debt securities (including corporate and municipal bonds, debentures, notes and commercial paper) and preferred
stock rated by MJKK or MSFJ (as applicable) have, prior to assignment of any credit rating, agreed to pay to MJKK or MSFJ (as applicable) for credit ratings opinions and services
rendered by it fees ranging from JPY125,000 to approximately JPY550,000,000 .
MJKK and MSFJ also maintain policies and procedures to address Japanese regulatory requirements.
REPORT NUMBER
1265358
10 11 February 2021
Cross-Sector: Market Data Highlights

MOODY'S ANALYTICS
CROSS-SECTOR
CLIENT SERVICES
Americas
1-212-553-1653
Asia Pacific
852-3551-3077
Japan
81-3-5408-4100
EMEA
44-20-7772-5454
11 11 February 2021
Cross-Sector: Market Data Highlights
