Despite Its High P/E Ratio, Is Northern Star Resources Limited (ASX:NST) Still Undervalued?

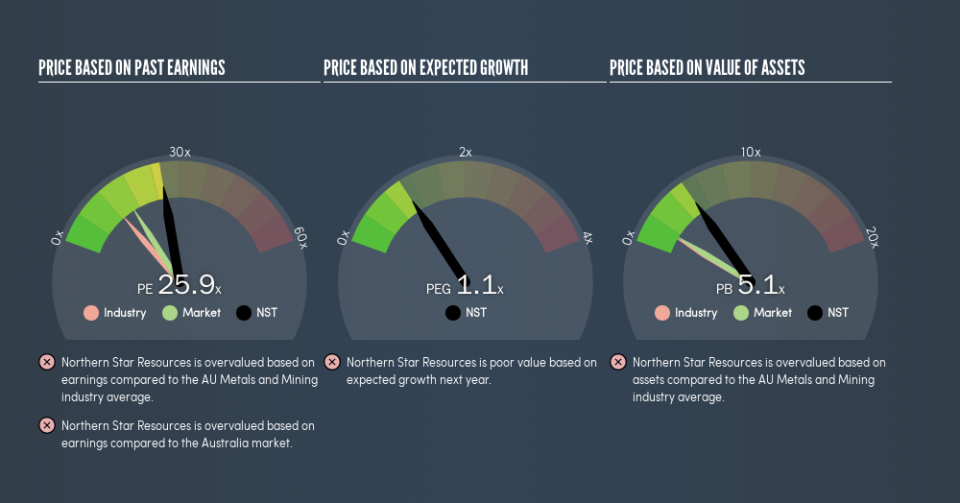
Today, we'll introduce the concept of the P/E ratio for those who are learning about investing. We'll apply a basic P/E ratio analysis to Northern Star Resources Limited's (ASX:NST), to help you decide if the stock is worth further research. What is Northern Star Resources's P/E ratio? Well, based on the last twelve months it is 25.91. That is equivalent to an earnings yield of about 3.9%.
See our latest analysis for Northern Star Resources
How Do You Calculate A P/E Ratio?
The formula for P/E is:
Price to Earnings Ratio = Price per Share ÷ Earnings per Share (EPS)
Or for Northern Star Resources:
P/E of 25.91 = A$8.26 ÷ A$0.32 (Based on the trailing twelve months to December 2018.)
Is A High Price-to-Earnings Ratio Good?
A higher P/E ratio means that investors are paying a higher price for each A$1 of company earnings. That isn't necessarily good or bad, but a high P/E implies relatively high expectations of what a company can achieve in the future.
How Growth Rates Impact P/E Ratios
Earnings growth rates have a big influence on P/E ratios. Earnings growth means that in the future the 'E' will be higher. That means even if the current P/E is high, it will reduce over time if the share price stays flat. And as that P/E ratio drops, the company will look cheap, unless its share price increases.
Northern Star Resources's earnings per share grew by -4.7% in the last twelve months. And earnings per share have improved by 58% annually, over the last five years.
How Does Northern Star Resources's P/E Ratio Compare To Its Peers?
The P/E ratio indicates whether the market has higher or lower expectations of a company. You can see in the image below that the average P/E (12.6) for companies in the metals and mining industry is lower than Northern Star Resources's P/E.
That means that the market expects Northern Star Resources will outperform other companies in its industry. The market is optimistic about the future, but that doesn't guarantee future growth. So investors should delve deeper. I like to check if company insiders have been buying or selling.
A Limitation: P/E Ratios Ignore Debt and Cash In The Bank
It's important to note that the P/E ratio considers the market capitalization, not the enterprise value. That means it doesn't take debt or cash into account. Hypothetically, a company could reduce its future P/E ratio by spending its cash (or taking on debt) to achieve higher earnings.
Such spending might be good or bad, overall, but the key point here is that you need to look at debt to understand the P/E ratio in context.
How Does Northern Star Resources's Debt Impact Its P/E Ratio?
The extra options and safety that comes with Northern Star Resources's AU$188m net cash position means that it deserves a higher P/E than it would if it had a lot of net debt.
The Bottom Line On Northern Star Resources's P/E Ratio
Northern Star Resources trades on a P/E ratio of 25.9, which is above the AU market average of 16.2. Earnings improved over the last year. And the net cash position provides the company with multiple options. The high P/E suggests the market thinks further growth will come.
Investors should be looking to buy stocks that the market is wrong about. If the reality for a company is better than it expects, you can make money by buying and holding for the long term. So this free report on the analyst consensus forecasts could help you make a master move on this stock.
But note: Northern Star Resources may not be the best stock to buy. So take a peek at this free list of interesting companies with strong recent earnings growth (and a P/E ratio below 20).
We aim to bring you long-term focused research analysis driven by fundamental data. Note that our analysis may not factor in the latest price-sensitive company announcements or qualitative material.
If you spot an error that warrants correction, please contact the editor at editorial-team@simplywallst.com. This article by Simply Wall St is general in nature. It does not constitute a recommendation to buy or sell any stock, and does not take account of your objectives, or your financial situation. Simply Wall St has no position in the stocks mentioned. Thank you for reading.
