Did Clover Corporation Limited (ASX:CLV) Create Value For Shareholders?

The content of this article will benefit those of you who are starting to educate yourself about investing in the stock market and want to begin learning the link between Clover Corporation Limited (ASX:CLV)’s return fundamentals and stock market performance.
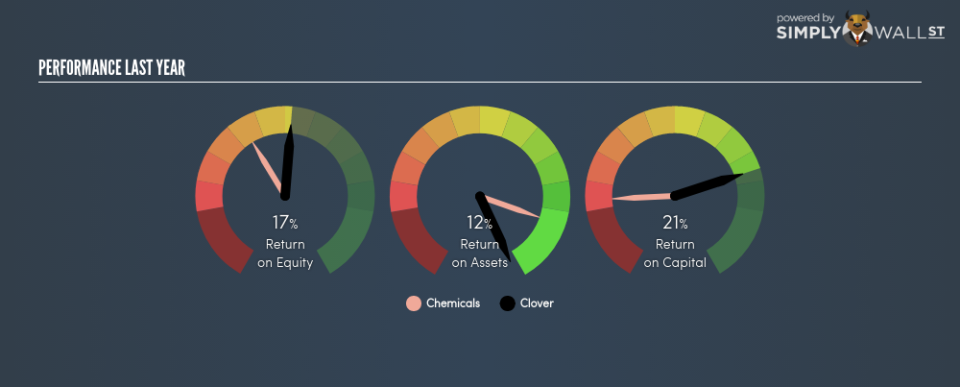
With an ROE of 16.74%, Clover Corporation Limited (ASX:CLV) outpaced its own industry which delivered a less exciting 11.00% over the past year. On the surface, this looks fantastic since we know that CLV has made large profits from little equity capital; however, ROE doesn’t tell us if management have borrowed heavily to make this happen. We’ll take a closer look today at factors like financial leverage to determine whether CLV’s ROE is actually sustainable. See our latest analysis for Clover
Peeling the layers of ROE – trisecting a company’s profitability
Return on Equity (ROE) is a measure of Clover’s profit relative to its shareholders’ equity. It essentially shows how much the company can generate in earnings given the amount of equity it has raised. While a higher ROE is preferred in most cases, there are several other factors we should consider before drawing any conclusions.
Return on Equity = Net Profit ÷ Shareholders Equity
ROE is measured against cost of equity in order to determine the efficiency of Clover’s equity capital deployed. Its cost of equity is 8.55%. This means Clover returns enough to cover its own cost of equity, with a buffer of 8.19%. This sustainable practice implies that the company pays less for its capital than what it generates in return. ROE can be broken down into three different ratios: net profit margin, asset turnover, and financial leverage. This is called the Dupont Formula:
Dupont Formula
ROE = profit margin × asset turnover × financial leverage
ROE = (annual net profit ÷ sales) × (sales ÷ assets) × (assets ÷ shareholders’ equity)
ROE = annual net profit ÷ shareholders’ equity
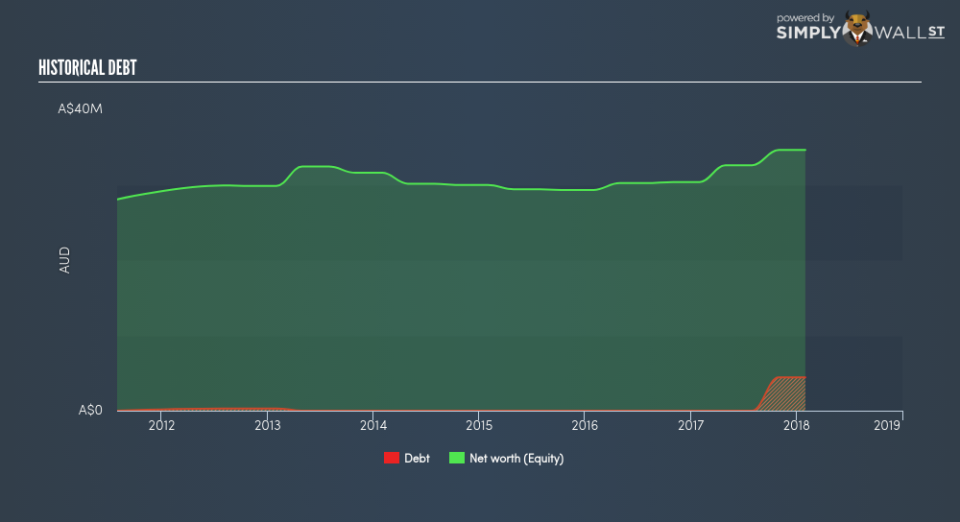
The first component is profit margin, which measures how much of sales is retained after the company pays for all its expenses. Asset turnover shows how much revenue Clover can generate with its current asset base. Finally, financial leverage will be our main focus today. It shows how much of assets are funded by equity and can show how sustainable the company’s capital structure is. Since ROE can be inflated by excessive debt, we need to examine Clover’s debt-to-equity level. The debt-to-equity ratio currently stands at a low 12.75%, meaning the above-average ROE is due to its capacity to produce profit growth without a huge debt burden.
Next Steps:
While ROE is a relatively simple calculation, it can be broken down into different ratios, each telling a different story about the strengths and weaknesses of a company. Clover’s above-industry ROE is encouraging, and is also in excess of its cost of equity. Its high ROE is not likely to be driven by high debt. Therefore, investors may have more confidence in the sustainability of this level of returns going forward. ROE is a helpful signal, but it is definitely not sufficient on its own to make an investment decision.
For Clover, I’ve put together three pertinent factors you should further research:
Financial Health: Does it have a healthy balance sheet? Take a look at our free balance sheet analysis with six simple checks on key factors like leverage and risk.
Valuation: What is Clover worth today? Is the stock undervalued, even when its growth outlook is factored into its intrinsic value? The intrinsic value infographic in our free research report helps visualize whether Clover is currently mispriced by the market.
Other High-Growth Alternatives : Are there other high-growth stocks you could be holding instead of Clover? Explore our interactive list of stocks with large growth potential to get an idea of what else is out there you may be missing!
To help readers see pass the short term volatility of the financial market, we aim to bring you a long-term focused research analysis purely driven by fundamental data. Note that our analysis does not factor in the latest price sensitive company announcements.
The author is an independent contributor and at the time of publication had no position in the stocks mentioned.
